
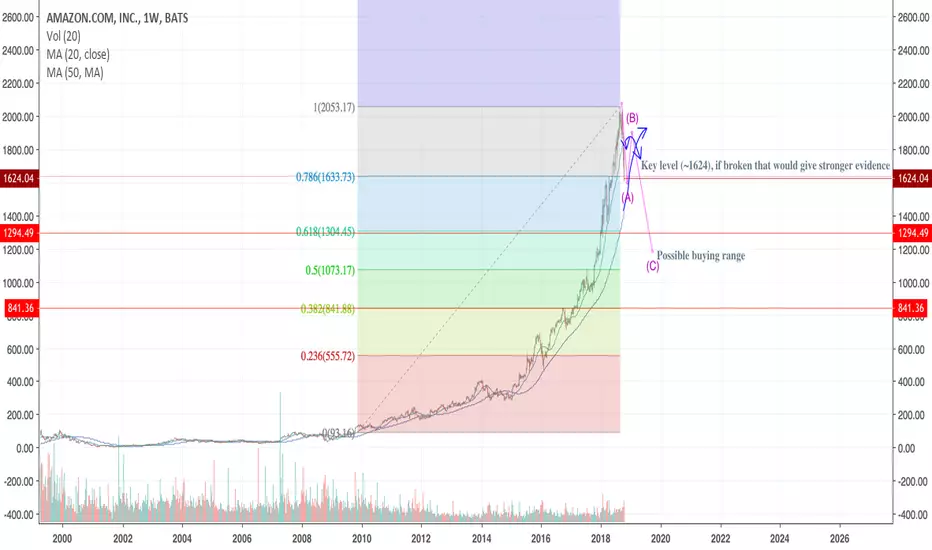
Labeled some key levels of significance and used a fib retracement chart to estimate landing zones.
Prior mini-tops retraced to about the .5 fib level. The larger cycle correction could also obey this level but may drag lower to the .618 range, which is why I gave a range for where the price could land.
~1600 is a key level of significance, if it breaks we will be going much lower.
The real question is, can amazon reach ATH? Watch the volume carefully when we have the bounce back up. Should be good indicator for remaining bull strength.
Prior mini-tops retraced to about the .5 fib level. The larger cycle correction could also obey this level but may drag lower to the .618 range, which is why I gave a range for where the price could land.
~1600 is a key level of significance, if it breaks we will be going much lower.
The real question is, can amazon reach ATH? Watch the volume carefully when we have the bounce back up. Should be good indicator for remaining bull strength.
ノート
Edit: prior mini-corrections typically retrace to .618. The larger cycle level correction could drag it around the .5 range.
免責事項
これらの情報および投稿は、TradingViewが提供または承認する金融、投資、取引、またはその他の種類の助言もしくは推奨であることを意図したものではなく、またこれらに該当するものでもありません。詳細は利用規約をご覧ください。
免責事項
これらの情報および投稿は、TradingViewが提供または承認する金融、投資、取引、またはその他の種類の助言もしくは推奨であることを意図したものではなく、またこれらに該当するものでもありません。詳細は利用規約をご覧ください。