
Hello?
Dear traders, nice to meet you.
"Like" is a huge force for me.
By "following" you can always get new information quickly.
Thank you for always supporting me.
-------------------------------------------------- -----
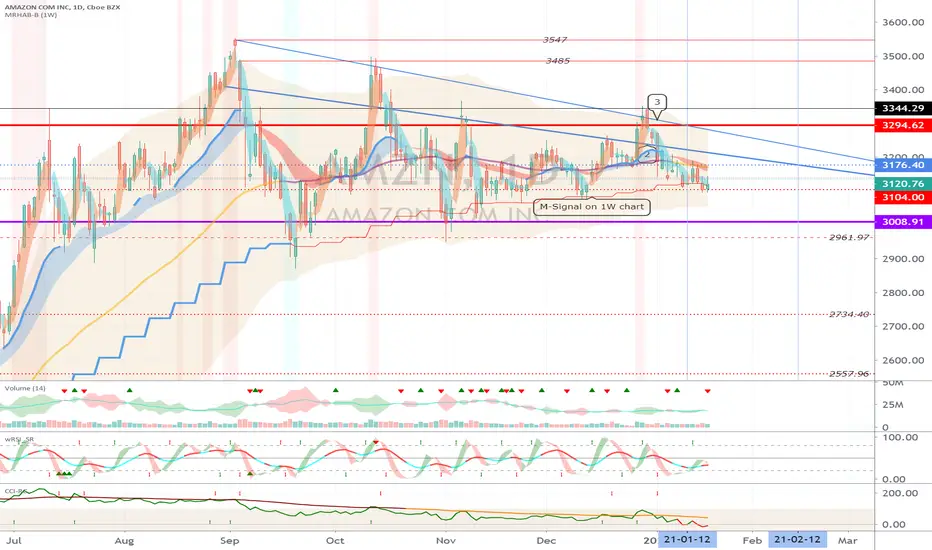
You'll have to watch for any movement that deviates from the large box section, 3008.91-3294.62.
You'll have to watch for any movement that deviates from the small box segment 3104.0-3176.40.
If you do not rise above the M-Signal line on the 1W chart, you can finally touch the 3008.91 point.
So, we have to see if it can rise quickly.
In the wRSI_SR indicator, the RS line declined without breaking above 50.
In addition, the CCI line fell below zero in the CCI-RC indicator.
This seems to be opening the door to a downturn.
However, it may be a fake, so it is better to stop trading for a while and check the flow.
---------------------------------
(DJI 1D chart)

It started with the gap (30814.3-30887.4) rising and closed at 0.38%.
-------------------------------
(IXIC 1D chart)

It started with the gap (12998.5-13132.7) rising and closed at 1.53%.
----------------------------------
(SPX 1D chart)

It started with the gap (3768.3-3781.9) rising and closed at 0.81%.
----------------------------------
(XAUUSD 1D chart)

You should watch for movements that deviate from the uptrend line (7)-downtrend line (5).
In particular, it remains to be seen if the volatility around January 21 could increase to the 1855.5-1871.828 range.
---------------------------------------------
(USOIL 1D chart)

We need to see if it can rise along the uptrend line (3).
In particular, it remains to be seen if it can break above the downtrend line (1).
-------------------------------------------------- -------------------------------------------
** All indicators are lagging indicators.
So, it's important to be aware that the indicator moves accordingly with the movement of price and volume.
Just for convenience, we are talking upside down for interpretation of the indicators.
** The wRSI_SR indicator is an indicator created by adding settings and options from the existing Stochastic RSI indicator.
Hence, the interpretation is the same as the conventional Stochastic RSI indicator. (K, D line -> R, S line)
** The OBV indicator was re-created by applying a formula from the DepthHouse Trading indicator, an indicator that oh92 disclosed. (Thank you for this.)
** Check support, resistance, and abbreviation points.
** Support or resistance is based on the closing price of the 1D chart.
** All explanations are for reference only and do not guarantee profit or loss on investment.
Explanation of abbreviations displayed on the chart
R: A point or section of resistance that requires a response to preserve profits
S-L: Stop Loss point or section
S: A point or segment that can be bought for profit generation as a support point or segment
(Short-term Stop Loss can be said to be a point where profits or losses can be preserved or additionally entered through installment transactions. It is a short-term investment perspective.)
GAP refers to the difference in prices that occurred when the stock market, CME, and BAKKT exchanges were closed because they do not trade 24 hours a day.
G1: Closed price
G2: Market price at the time of opening
(Example) Gap (G1-G2)
Dear traders, nice to meet you.
"Like" is a huge force for me.
By "following" you can always get new information quickly.
Thank you for always supporting me.
-------------------------------------------------- -----
You'll have to watch for any movement that deviates from the large box section, 3008.91-3294.62.
You'll have to watch for any movement that deviates from the small box segment 3104.0-3176.40.
If you do not rise above the M-Signal line on the 1W chart, you can finally touch the 3008.91 point.
So, we have to see if it can rise quickly.
In the wRSI_SR indicator, the RS line declined without breaking above 50.
In addition, the CCI line fell below zero in the CCI-RC indicator.
This seems to be opening the door to a downturn.
However, it may be a fake, so it is better to stop trading for a while and check the flow.
---------------------------------
(DJI 1D chart)
It started with the gap (30814.3-30887.4) rising and closed at 0.38%.
-------------------------------
(IXIC 1D chart)
It started with the gap (12998.5-13132.7) rising and closed at 1.53%.
----------------------------------
(SPX 1D chart)
It started with the gap (3768.3-3781.9) rising and closed at 0.81%.
----------------------------------
(XAUUSD 1D chart)
You should watch for movements that deviate from the uptrend line (7)-downtrend line (5).
In particular, it remains to be seen if the volatility around January 21 could increase to the 1855.5-1871.828 range.
---------------------------------------------
(USOIL 1D chart)
We need to see if it can rise along the uptrend line (3).
In particular, it remains to be seen if it can break above the downtrend line (1).
-------------------------------------------------- -------------------------------------------
** All indicators are lagging indicators.
So, it's important to be aware that the indicator moves accordingly with the movement of price and volume.
Just for convenience, we are talking upside down for interpretation of the indicators.
** The wRSI_SR indicator is an indicator created by adding settings and options from the existing Stochastic RSI indicator.
Hence, the interpretation is the same as the conventional Stochastic RSI indicator. (K, D line -> R, S line)
** The OBV indicator was re-created by applying a formula from the DepthHouse Trading indicator, an indicator that oh92 disclosed. (Thank you for this.)
** Check support, resistance, and abbreviation points.
** Support or resistance is based on the closing price of the 1D chart.
** All explanations are for reference only and do not guarantee profit or loss on investment.
Explanation of abbreviations displayed on the chart
R: A point or section of resistance that requires a response to preserve profits
S-L: Stop Loss point or section
S: A point or segment that can be bought for profit generation as a support point or segment
(Short-term Stop Loss can be said to be a point where profits or losses can be preserved or additionally entered through installment transactions. It is a short-term investment perspective.)
GAP refers to the difference in prices that occurred when the stock market, CME, and BAKKT exchanges were closed because they do not trade 24 hours a day.
G1: Closed price
G2: Market price at the time of opening
(Example) Gap (G1-G2)
ノート
Check the support and resistance points.(WPX 1D chart)
(BB 1D chart)
(NIO 1D chart)
(AAPL 1D chart)
(FORD (F) 1D chart)
(BAC 1D chart)
(GME 1D chart)
(GM 1D chart)
(GE 1D chart)
(TSLA 1D chart)

YouTube: youtube.com/@readcrypto9837
※ Follow X to check out the posts.
※ X를 팔로우하고 게시물을 확인하세요.
◆ t.me/readCryptoChannel
[HA-MS Indicator]
bit.ly/3YxHgvN
[OBV Indicator]
bit.ly/4dcyny3
※ Follow X to check out the posts.
※ X를 팔로우하고 게시물을 확인하세요.
◆ t.me/readCryptoChannel
[HA-MS Indicator]
bit.ly/3YxHgvN
[OBV Indicator]
bit.ly/4dcyny3
関連の投稿
免責事項
これらの情報および投稿は、TradingViewが提供または承認する金融、投資、取引、またはその他の種類の助言もしくは推奨であることを意図したものではなく、またこれらに該当するものでもありません。詳細は利用規約をご覧ください。
YouTube: youtube.com/@readcrypto9837
※ Follow X to check out the posts.
※ X를 팔로우하고 게시물을 확인하세요.
◆ t.me/readCryptoChannel
[HA-MS Indicator]
bit.ly/3YxHgvN
[OBV Indicator]
bit.ly/4dcyny3
※ Follow X to check out the posts.
※ X를 팔로우하고 게시물을 확인하세요.
◆ t.me/readCryptoChannel
[HA-MS Indicator]
bit.ly/3YxHgvN
[OBV Indicator]
bit.ly/4dcyny3
関連の投稿
免責事項
これらの情報および投稿は、TradingViewが提供または承認する金融、投資、取引、またはその他の種類の助言もしくは推奨であることを意図したものではなく、またこれらに該当するものでもありません。詳細は利用規約をご覧ください。