更新済
APHA Rising Wedge on Hourly Uptrend
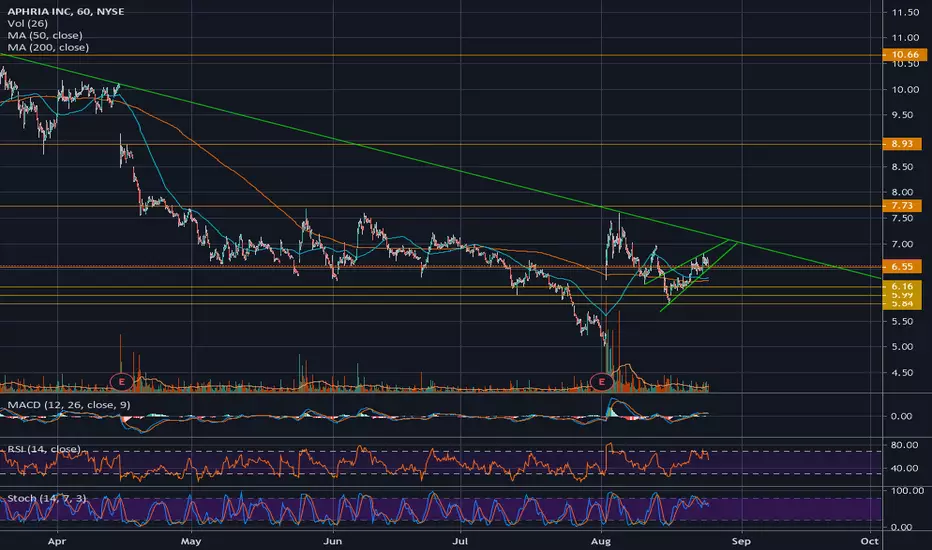
Rising wedge pattern on the hourly chart. Daily indicators show possible underlying strength, but hourly volume is decreasing. Broader markets could see a bounce on Monday, and APHA is likely to participate, but chances are very small that it'll break this pattern bullish.
Trade with caution.
Trade with caution.
ノート
As expected, a bearish confirmation of this rising wedge pattern. Now we are looking at a descending triangle on the daily charts, another bearish pattern, indicating that APHA may want to close the bull gap before reaching for new highs. It makes sense, to expect buyers to wait there, patiently. Seems like a great level to get in for a long position - $5.20ish.ノート
Correction - $5.40ish
🅱🄰🆁🅺🆆🄾🆁🆃🅷
theBarkworthyNotes.com
theBarkworthyNotes.com
免責事項
これらの情報および投稿は、TradingViewが提供または承認する金融、投資、取引、またはその他の種類の助言もしくは推奨であることを意図したものではなく、またこれらに該当するものでもありません。詳細は利用規約をご覧ください。
🅱🄰🆁🅺🆆🄾🆁🆃🅷
theBarkworthyNotes.com
theBarkworthyNotes.com
免責事項
これらの情報および投稿は、TradingViewが提供または承認する金融、投資、取引、またはその他の種類の助言もしくは推奨であることを意図したものではなく、またこれらに該当するものでもありません。詳細は利用規約をご覧ください。