
Hello traders,
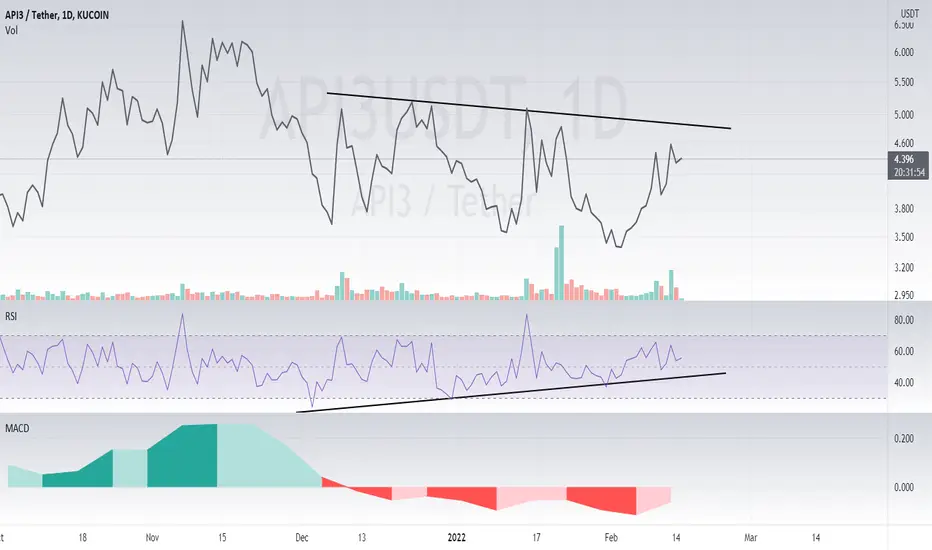
As you can see on the daily chart of API3, the price performance has been in a downtrend recently however the Momentum Oscillator (RSI) is showing a bullish divergence by presenting us with lower lows! The weekly MACD is also revealing a possible divergence to the green, I see a very low likely hood of it continuing to be red mainly due to the fact MACD's come in swings of 3, which we have already experienced.
Safe trading,
-Pulkanator
As you can see on the daily chart of API3, the price performance has been in a downtrend recently however the Momentum Oscillator (RSI) is showing a bullish divergence by presenting us with lower lows! The weekly MACD is also revealing a possible divergence to the green, I see a very low likely hood of it continuing to be red mainly due to the fact MACD's come in swings of 3, which we have already experienced.
Safe trading,
-Pulkanator

免責事項
これらの情報および投稿は、TradingViewが提供または承認する金融、投資、取引、またはその他の種類の助言もしくは推奨であることを意図したものではなく、またこれらに該当するものでもありません。詳細は利用規約をご覧ください。
免責事項
これらの情報および投稿は、TradingViewが提供または承認する金融、投資、取引、またはその他の種類の助言もしくは推奨であることを意図したものではなく、またこれらに該当するものでもありません。詳細は利用規約をご覧ください。