
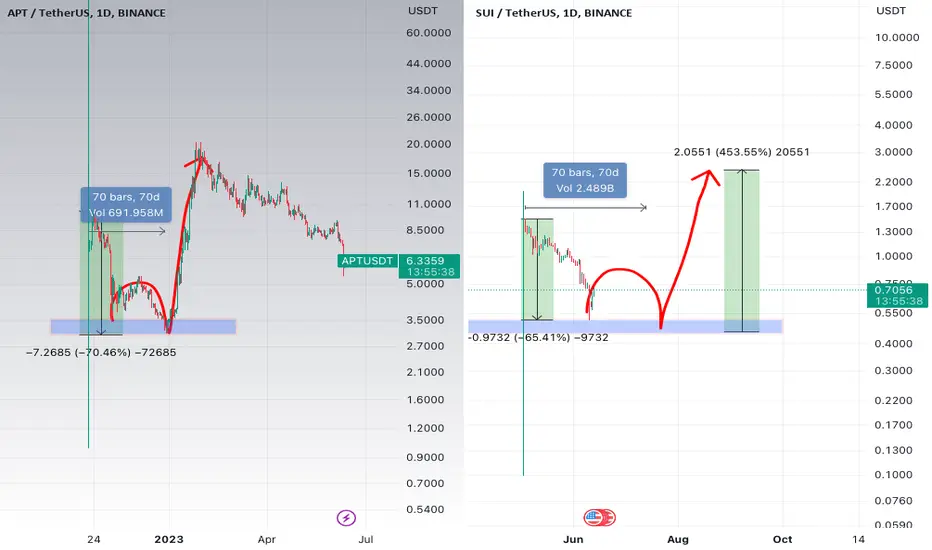
Friends, hello everyone! I noticed an interesting similarity between two assets - SUI and Atop. After the decline, both assets experienced approximately a 70% loss. However, if we look at APT, we can observe an intriguing pattern - it showed a decline, followed by a minor correction, a final impulse (where the best entry point was), and a 400% increase.
Now, as SUI has undergone a decline, we are observing a slight correction, after which we expect a final impulse and further growth.
It's fascinating to see what will happen with these assets going forward! Let's keep an eye out for updates.
Now, as SUI has undergone a decline, we are observing a slight correction, after which we expect a final impulse and further growth.
It's fascinating to see what will happen with these assets going forward! Let's keep an eye out for updates.

Copy my strategy - copy.mytimebox.app/
TG ENG - t.me/+B_BEn6COneo2ZTBi
TG - t.me/+LTNPinehDNlkZTQy
TG ENG - t.me/+B_BEn6COneo2ZTBi
TG - t.me/+LTNPinehDNlkZTQy
免責事項
これらの情報および投稿は、TradingViewが提供または承認する金融、投資、取引、またはその他の種類の助言もしくは推奨であることを意図したものではなく、またこれらに該当するものでもありません。詳細は利用規約をご覧ください。
Copy my strategy - copy.mytimebox.app/
TG ENG - t.me/+B_BEn6COneo2ZTBi
TG - t.me/+LTNPinehDNlkZTQy
TG ENG - t.me/+B_BEn6COneo2ZTBi
TG - t.me/+LTNPinehDNlkZTQy
免責事項
これらの情報および投稿は、TradingViewが提供または承認する金融、投資、取引、またはその他の種類の助言もしくは推奨であることを意図したものではなく、またこれらに該当するものでもありません。詳細は利用規約をご覧ください。