
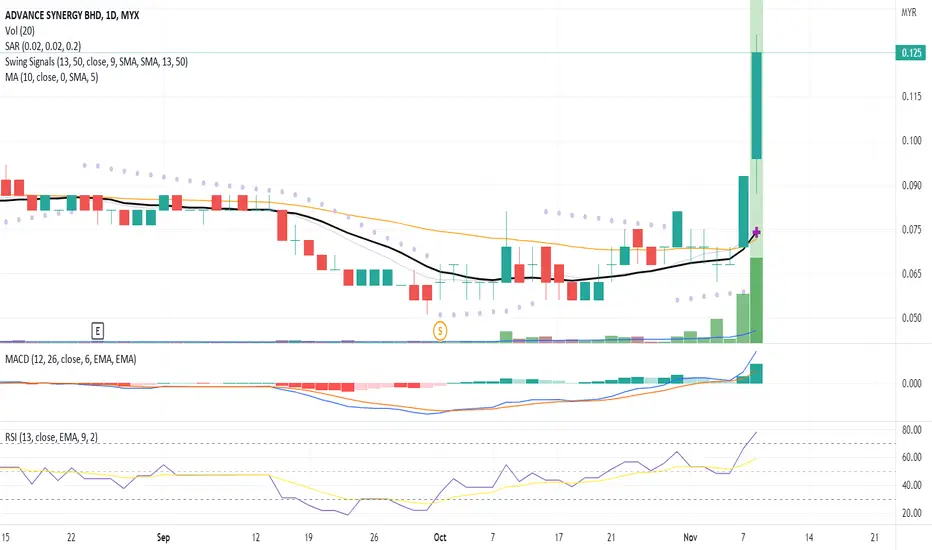
The candlestick indicates a breakout signal due to significant price movement backed by high volume with the price closed above the MA50 line.
The MACD signal is in a positive trend, hence, confirming the price uptrend toward the next price resistance.
The RSI cross-up of the indexer 70 indexer due to fresh buying interest on the stock making the candlestick in a breakout pattern.
Precaution for a price correction between 5%-10% from the recent peak before continuing with a price uptrend towards the next price resistance.
Let's save ASB in WL and watch out for significant price movement backed with volume toward the next price resistance.
R 0.195
S 0.080
The MACD signal is in a positive trend, hence, confirming the price uptrend toward the next price resistance.
The RSI cross-up of the indexer 70 indexer due to fresh buying interest on the stock making the candlestick in a breakout pattern.
Precaution for a price correction between 5%-10% from the recent peak before continuing with a price uptrend towards the next price resistance.
Let's save ASB in WL and watch out for significant price movement backed with volume toward the next price resistance.
R 0.195
S 0.080

免責事項
これらの情報および投稿は、TradingViewが提供または承認する金融、投資、取引、またはその他の種類の助言もしくは推奨であることを意図したものではなく、またこれらに該当するものでもありません。詳細は利用規約をご覧ください。
免責事項
これらの情報および投稿は、TradingViewが提供または承認する金融、投資、取引、またはその他の種類の助言もしくは推奨であることを意図したものではなく、またこれらに該当するものでもありません。詳細は利用規約をご覧ください。