
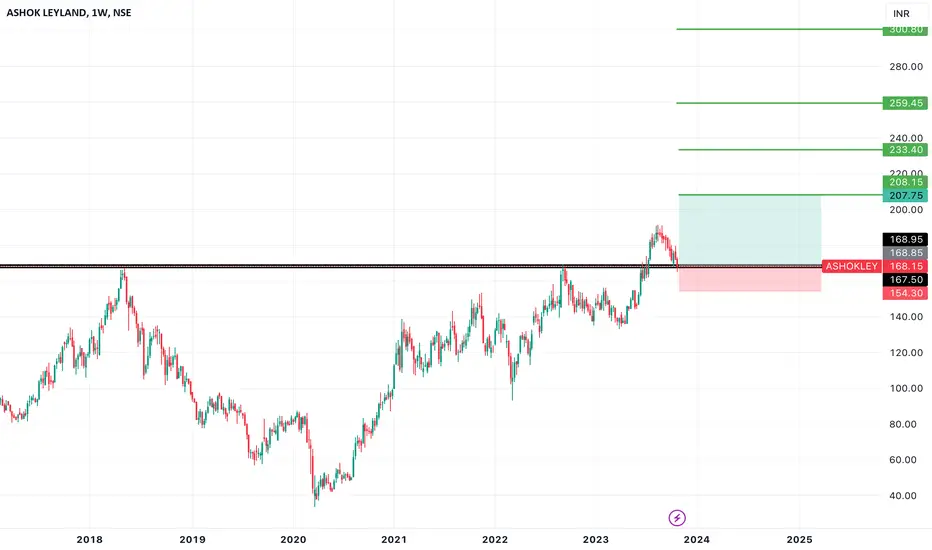
This chart reveals a harmonious convergence of price action and key indicators, suggesting a potential buy opportunity on the horizon. The stock has displayed remarkable strength, with patterns that indicate a possible upward trajectory.
Reasons are stated below :
ASHOK LEYLAND is a fundamentally strong stock on which we can rely.
this seems to be a golden opportunity to buy this gem.
TARGETS - 207 // 233 // 260 // 300
SL - 154
thank you.
Reasons are stated below :
- price tested 168 levels twice on weekly tf and finally has come down to retest after a strong breakout
- 0.382 Fibonacci level support
- 50EMA support on daily tf
- formed 2 hammer like candles with a long wick indicating a buy-push
ASHOK LEYLAND is a fundamentally strong stock on which we can rely.
this seems to be a golden opportunity to buy this gem.
TARGETS - 207 // 233 // 260 // 300
SL - 154
thank you.
ノート
We can see a double bottom pattern on daily timeframe, can add up some quantity.ノート
We are up by 8.4% from buying price.It made a high of 9.4%.
Stock looks quite strong, we can hold for our targets.
ノート
currently, stock is in consolidation phase. Technicals look quite promising, so we can hold till targets.
ノート
stock is still consolidating. Once 190 level is taken out we will see a sharp upmove.ノート
Accumulate as much as possible, even if you're looking for investment.This the best price.
ノート
A strong marabozu candle on weekly timeframe shows incoming momentum.The stock can potentially rally now, hold for targets !!
ノート
Achieved 15% ++Hold for targets
ノート
We are very close to our 1st targetPrice made a high of 19.5% ++
ノート
made a high of 22%トレード終了: 利益確定目標に到達
1st target achieved : 24% ++ノート
Very close to 2nd target, made a high of 36% ++ from our buying levelノート
trend seems strong, can accumulate at 190 levelsトレード終了: 利益確定目標に到達
2nd target achieved 40%++ノート
getting closer to 3rd target of 260トレード終了: 利益確定目標に到達
3rd target achieved : 53%++ノート
made a high of 55%++
免責事項
これらの情報および投稿は、TradingViewが提供または承認する金融、投資、取引、またはその他の種類の助言もしくは推奨であることを意図したものではなく、またこれらに該当するものでもありません。詳細は利用規約をご覧ください。
免責事項
これらの情報および投稿は、TradingViewが提供または承認する金融、投資、取引、またはその他の種類の助言もしくは推奨であることを意図したものではなく、またこれらに該当するものでもありません。詳細は利用規約をご覧ください。