
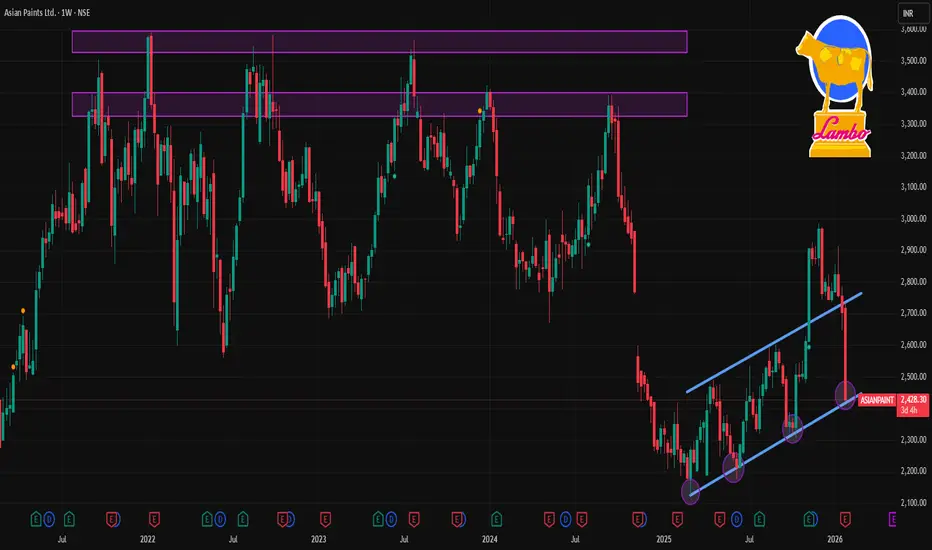
📊 Current Price Context
Recent share price was trading around ₹2,423–₹2,515 range (latest intraday/previous close range) according to market data.
📈 Weekly Timeframe Levels — Asian Paints (NSE)
🔴 Resistance (Upside)
These are levels where price may face selling pressure or pause on the upside in the coming week:
1. ₹2,560–₹2,565 — Immediate near‑term resistance zone seen from short weekly consolidations.
2. ₹2,720–₹2,760 — Mid resistance zone where upside moves often stall on weekly/daily clusters.
3. ₹2,820–₹2,860+ — Higher weekly resistance zone — breakout above this could indicate stronger momentum.
🟢 Support (Downside)
These are levels where price might find buying interest or a floor on weekly charts:
1. ₹2,440–₹2,460 — Immediate support from weekly lower bands and short pivot support.
2. ₹2,340–₹2,380 — Secondary support zone seen from historical price clusters and volatility bands.
3. ₹2,300–₹2,250 — Major structural support — breakdown here could lead to deeper correction.
📉 Pivot Zone
₹2,500–₹2,530 — A central pivot/neutral range this week; trading above suggests short bullish bias, below suggests bearish.
📌 Weekly Technical Bias (Summary)
Bullish Scenario: A sustained weekly close above ₹2,560–₹2,565 opens path toward ₹2,720–₹2,860.
Bearish Scenario: Failure to hold ₹2,440–₹2,460 could drag price toward ₹2,340–₹2,300 on the weekly chart.
Range Play: Price oscillating between ₹2,440 – ₹2,560 indicates consolidative behavior typical in neutral markets.
Recent share price was trading around ₹2,423–₹2,515 range (latest intraday/previous close range) according to market data.
📈 Weekly Timeframe Levels — Asian Paints (NSE)
🔴 Resistance (Upside)
These are levels where price may face selling pressure or pause on the upside in the coming week:
1. ₹2,560–₹2,565 — Immediate near‑term resistance zone seen from short weekly consolidations.
2. ₹2,720–₹2,760 — Mid resistance zone where upside moves often stall on weekly/daily clusters.
3. ₹2,820–₹2,860+ — Higher weekly resistance zone — breakout above this could indicate stronger momentum.
🟢 Support (Downside)
These are levels where price might find buying interest or a floor on weekly charts:
1. ₹2,440–₹2,460 — Immediate support from weekly lower bands and short pivot support.
2. ₹2,340–₹2,380 — Secondary support zone seen from historical price clusters and volatility bands.
3. ₹2,300–₹2,250 — Major structural support — breakdown here could lead to deeper correction.
📉 Pivot Zone
₹2,500–₹2,530 — A central pivot/neutral range this week; trading above suggests short bullish bias, below suggests bearish.
📌 Weekly Technical Bias (Summary)
Bullish Scenario: A sustained weekly close above ₹2,560–₹2,565 opens path toward ₹2,720–₹2,860.
Bearish Scenario: Failure to hold ₹2,440–₹2,460 could drag price toward ₹2,340–₹2,300 on the weekly chart.
Range Play: Price oscillating between ₹2,440 – ₹2,560 indicates consolidative behavior typical in neutral markets.

Contact Knowledgehub for a detailed consultation: Dm on WhatsApp: [wa.link/a2o0kz]-
Phone No: [+91 93102 26243]-
Email: [tradingviewknowledgehub@gmail.com]---
-- Let’s achieve success together!
Phone No: [+91 93102 26243]-
Email: [tradingviewknowledgehub@gmail.com]---
-- Let’s achieve success together!
関連の投稿
免責事項
これらの情報および投稿は、TradingViewが提供または承認する金融、投資、取引、またはその他の種類の助言もしくは推奨であることを意図したものではなく、またこれらに該当するものでもありません。詳細は利用規約をご覧ください。
Contact Knowledgehub for a detailed consultation: Dm on WhatsApp: [wa.link/a2o0kz]-
Phone No: [+91 93102 26243]-
Email: [tradingviewknowledgehub@gmail.com]---
-- Let’s achieve success together!
Phone No: [+91 93102 26243]-
Email: [tradingviewknowledgehub@gmail.com]---
-- Let’s achieve success together!
関連の投稿
免責事項
これらの情報および投稿は、TradingViewが提供または承認する金融、投資、取引、またはその他の種類の助言もしくは推奨であることを意図したものではなく、またこれらに該当するものでもありません。詳細は利用規約をご覧ください。