
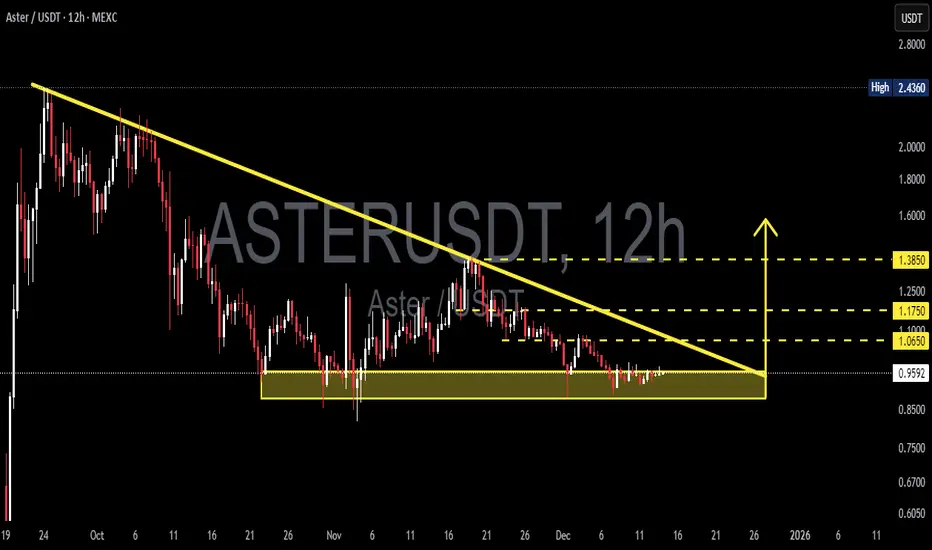
ASTER/USDT is currently trading within a medium-term bearish trend, characterized by a clear sequence of lower highs and lower lows. Price continues to respect a descending trendline, acting as strong dynamic resistance and consistently rejecting bullish attempts.
At the same time, price has reached a major demand zone between 0.96 – 0.88 (yellow box), which has previously served as a strong accumulation area. This zone now represents a decisive battlefield between buyers and sellers.
---
Pattern Explanation
Descending Triangle / Bearish Continuation Structure
Price is forming lower highs beneath a descending trendline, indicating sustained selling pressure.
Horizontal support is well-defined at the 0.96 – 0.88 demand zone.
This structure typically favors a bearish continuation, but a bullish reversal remains possible if demand holds and structure shifts.
Demand Zone (0.96 – 0.88)
This area reflects previous accumulation and strong buyer interest.
Multiple candles show long lower wicks, signaling buying absorption.
A breakdown below this zone would likely trigger accelerated downside momentum.
---
Key Levels
Dynamic Resistance: Descending trendline
Minor Resistance: 1.065
Key Resistance: 1.175
Major Resistance: 1.385
Major Support / Demand: 0.96 – 0.88
---
Bullish Scenario
The bullish scenario remains valid as long as price holds above the 0.96 – 0.88 demand zone.
Bullish confirmation:
Strong bullish reaction from the demand zone
Break and candle close above the descending trendline
Market structure shift from lower highs to higher highs
Potential upside targets:
1.065 (initial resistance)
1.175
1.385 as a continuation target if momentum strengthens
A confirmed breakout above the trendline would signal a potential trend reversal.
---
Bearish Scenario
The bearish scenario becomes dominant if price breaks and closes below 0.88.
Bearish confirmation:
Clear 12H candle close below the demand zone
Failed retest of the 0.88 – 0.96 area
Increasing bearish volume during the breakdown
Downside expectation:
Continuation of the broader downtrend
Price searching for a new lower demand zone
---
Conclusion
ASTER/USDT is currently trading at a critical technical level.
The 0.96 – 0.88 demand zone will determine whether price:
Initiates a bullish reversal, or
Continues its bearish trend with a breakdown
Patience and confirmation are essential — avoid chasing price inside the zone.
---
#ASTERUSDT #CryptoAnalysis #TechnicalAnalysis #Altcoin #Downtrend #DemandZone #SupportResistance #ChartPattern #PriceAction #Breakout #Bearish #Bullish #MarketStructure
At the same time, price has reached a major demand zone between 0.96 – 0.88 (yellow box), which has previously served as a strong accumulation area. This zone now represents a decisive battlefield between buyers and sellers.
---
Pattern Explanation
Descending Triangle / Bearish Continuation Structure
Price is forming lower highs beneath a descending trendline, indicating sustained selling pressure.
Horizontal support is well-defined at the 0.96 – 0.88 demand zone.
This structure typically favors a bearish continuation, but a bullish reversal remains possible if demand holds and structure shifts.
Demand Zone (0.96 – 0.88)
This area reflects previous accumulation and strong buyer interest.
Multiple candles show long lower wicks, signaling buying absorption.
A breakdown below this zone would likely trigger accelerated downside momentum.
---
Key Levels
Dynamic Resistance: Descending trendline
Minor Resistance: 1.065
Key Resistance: 1.175
Major Resistance: 1.385
Major Support / Demand: 0.96 – 0.88
---
Bullish Scenario
The bullish scenario remains valid as long as price holds above the 0.96 – 0.88 demand zone.
Bullish confirmation:
Strong bullish reaction from the demand zone
Break and candle close above the descending trendline
Market structure shift from lower highs to higher highs
Potential upside targets:
1.065 (initial resistance)
1.175
1.385 as a continuation target if momentum strengthens
A confirmed breakout above the trendline would signal a potential trend reversal.
---
Bearish Scenario
The bearish scenario becomes dominant if price breaks and closes below 0.88.
Bearish confirmation:
Clear 12H candle close below the demand zone
Failed retest of the 0.88 – 0.96 area
Increasing bearish volume during the breakdown
Downside expectation:
Continuation of the broader downtrend
Price searching for a new lower demand zone
---
Conclusion
ASTER/USDT is currently trading at a critical technical level.
The 0.96 – 0.88 demand zone will determine whether price:
Initiates a bullish reversal, or
Continues its bearish trend with a breakdown
Patience and confirmation are essential — avoid chasing price inside the zone.
---
#ASTERUSDT #CryptoAnalysis #TechnicalAnalysis #Altcoin #Downtrend #DemandZone #SupportResistance #ChartPattern #PriceAction #Breakout #Bearish #Bullish #MarketStructure

✅ Get Free Signals! Join Our Telegram Channel Here: t.me/TheCryptoNuclear
✅ Twitter: twitter.com/crypto_nuclear
✅ Join Bybit : partner.bybit.com/b/nuclearvip
✅ Benefits : Lifetime Trading Fee Discount -50%
✅ Twitter: twitter.com/crypto_nuclear
✅ Join Bybit : partner.bybit.com/b/nuclearvip
✅ Benefits : Lifetime Trading Fee Discount -50%
免責事項
これらの情報および投稿は、TradingViewが提供または承認する金融、投資、取引、またはその他の種類の助言もしくは推奨であることを意図したものではなく、またこれらに該当するものでもありません。詳細は利用規約をご覧ください。
✅ Get Free Signals! Join Our Telegram Channel Here: t.me/TheCryptoNuclear
✅ Twitter: twitter.com/crypto_nuclear
✅ Join Bybit : partner.bybit.com/b/nuclearvip
✅ Benefits : Lifetime Trading Fee Discount -50%
✅ Twitter: twitter.com/crypto_nuclear
✅ Join Bybit : partner.bybit.com/b/nuclearvip
✅ Benefits : Lifetime Trading Fee Discount -50%
免責事項
これらの情報および投稿は、TradingViewが提供または承認する金融、投資、取引、またはその他の種類の助言もしくは推奨であることを意図したものではなく、またこれらに該当するものでもありません。詳細は利用規約をご覧ください。