
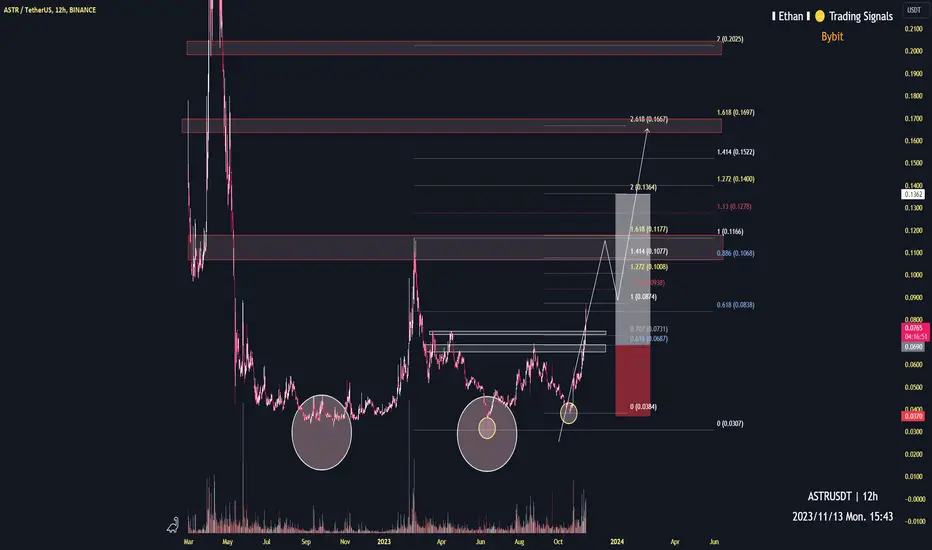
12h time frame
-
ASTR is creating two double bottoms, white and yellow circles which are marked on chart. This is a strong sign of bottom structure. Combining Fibonacci Projection with Structural resistance, we can have three targets as below. However, considering the potential dump of market, ASTR might reach 0.1~0.12 only then pull back with whole market, but we can still expect higher target when bull coming in 2024.
TP: 0.1~0.12 / 0.166 / 0.2
SL: 0.037

免責事項
これらの情報および投稿は、TradingViewが提供または承認する金融、投資、取引、またはその他の種類の助言もしくは推奨であることを意図したものではなく、またこれらに該当するものでもありません。詳細は利用規約をご覧ください。
免責事項
これらの情報および投稿は、TradingViewが提供または承認する金融、投資、取引、またはその他の種類の助言もしくは推奨であることを意図したものではなく、またこれらに該当するものでもありません。詳細は利用規約をご覧ください。