

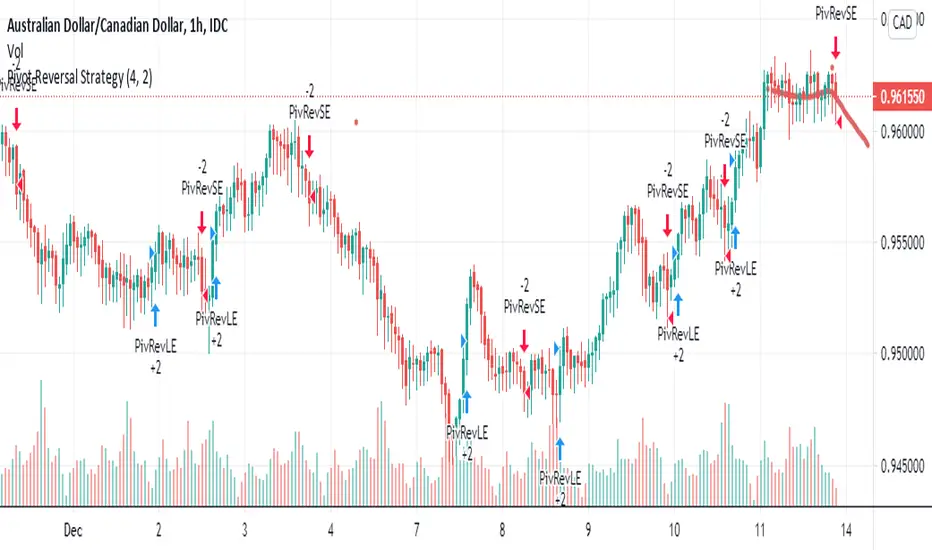
At the H4 chart there is a full back to 0.960 as the support 1. Once it breaks the support 1 will go to the extension 0.958 area. Reversal candlesticks will be formed as an indication of the pull back. On the uptrend 0.961 area is the one to break to push higher.

免責事項
これらの情報および投稿は、TradingViewが提供または承認する金融、投資、取引、またはその他の種類の助言もしくは推奨であることを意図したものではなく、またこれらに該当するものでもありません。詳細は利用規約をご覧ください。
免責事項
これらの情報および投稿は、TradingViewが提供または承認する金融、投資、取引、またはその他の種類の助言もしくは推奨であることを意図したものではなく、またこれらに該当するものでもありません。詳細は利用規約をご覧ください。