

Monthly Time Frame

Weekly Time Frame

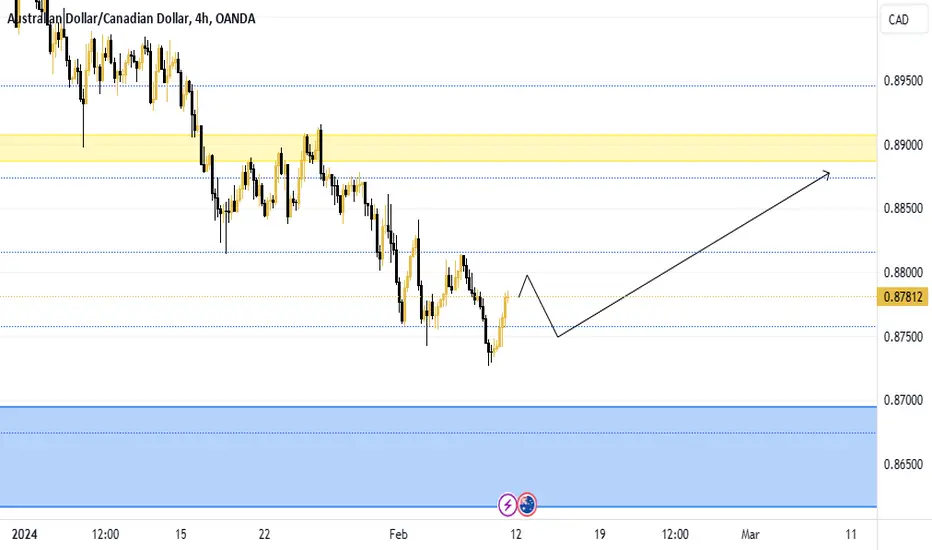
4Hour Time Frame

- Price made a bearish push until it closed as a doji candlestick found support at the weekly demand zone then made a bullish push
- After the bullish push price met resistance at a weekly supply zone ultimately forming a high. Price then began to sell off (retrace).
Weekly Time Frame
- Price met resistance, formed a double top, and closed as a doji followed by a bearish engulfing signaling a selloff.
- During the sell-off (retracement) price found support at the 61.8 fib level and closed as doji candle stick signaling a potential reversal.
4Hour Time Frame
- I am anticipating price forming a double bottom as a candlestick reversal pattern.
- I am expecting a bullish push to 0.895
ノート
Price is beginning to make its bullish push as anticapted.
免責事項
これらの情報および投稿は、TradingViewが提供または承認する金融、投資、取引、またはその他の種類の助言もしくは推奨であることを意図したものではなく、またこれらに該当するものでもありません。詳細は利用規約をご覧ください。
免責事項
これらの情報および投稿は、TradingViewが提供または承認する金融、投資、取引、またはその他の種類の助言もしくは推奨であることを意図したものではなく、またこれらに該当するものでもありません。詳細は利用規約をご覧ください。