

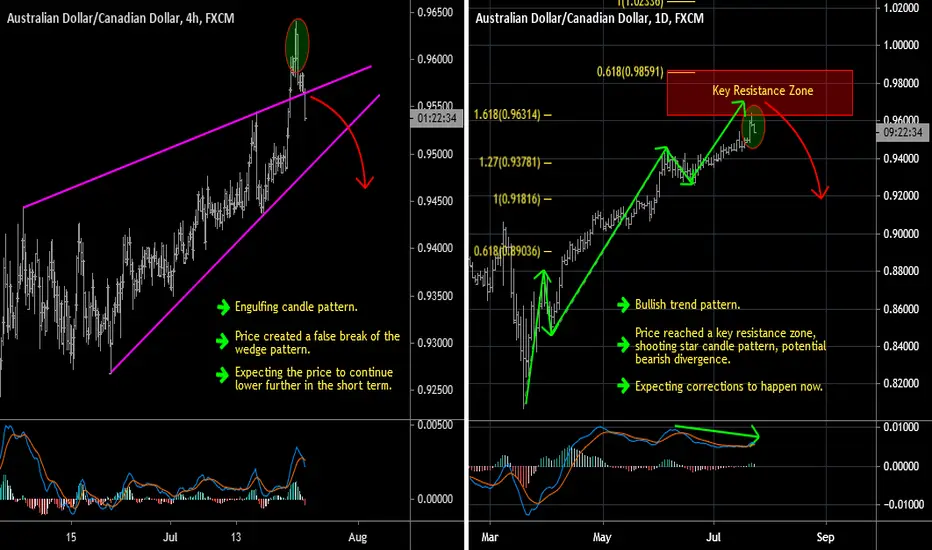
D1 - Bullish trend pattern.
The price has reached a key resistance zone formed by the 161.8% (0.96314) fibonacci expansion level of the first wave and the 61.8% (0.98591) fibonacci expansion level of the second wave. Shooting star candle pattern, potential bearish divergence.
Expecting corrections to happen now.
H4 - Engulfing candle pattern. The price has created a false break of the wedge pattern.
Expecting the price to continue lower further in the short term.
The price has reached a key resistance zone formed by the 161.8% (0.96314) fibonacci expansion level of the first wave and the 61.8% (0.98591) fibonacci expansion level of the second wave. Shooting star candle pattern, potential bearish divergence.
Expecting corrections to happen now.
H4 - Engulfing candle pattern. The price has created a false break of the wedge pattern.
Expecting the price to continue lower further in the short term.

免責事項
これらの情報および投稿は、TradingViewが提供または承認する金融、投資、取引、またはその他の種類の助言もしくは推奨であることを意図したものではなく、またこれらに該当するものでもありません。詳細は利用規約をご覧ください。
免責事項
これらの情報および投稿は、TradingViewが提供または承認する金融、投資、取引、またはその他の種類の助言もしくは推奨であることを意図したものではなく、またこれらに該当するものでもありません。詳細は利用規約をご覧ください。