

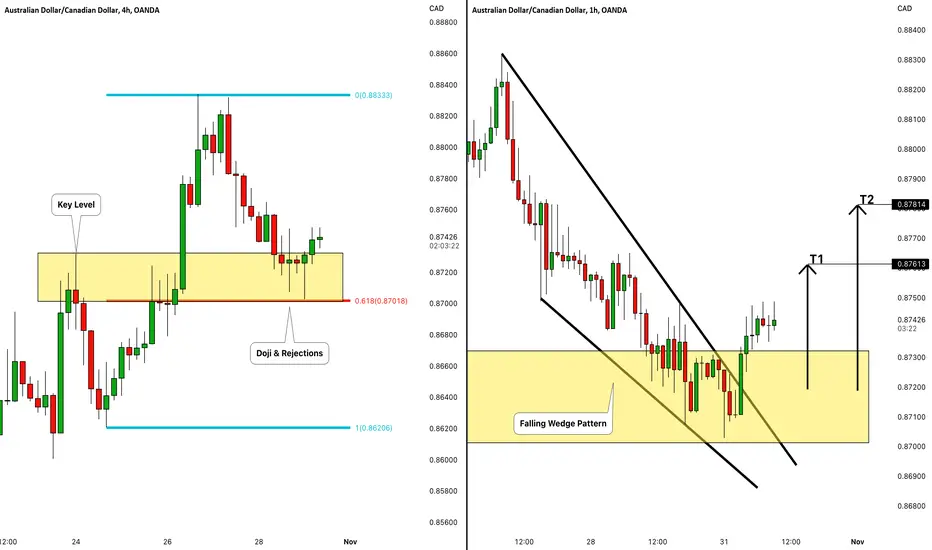
AUDCAD dropped to an important confluence zone last week.
The underlined yellow area is based on the intersection between 618 retracement of the last bullish impulse
and a horizontal intraday demand zone.
The market formed a doji candle on that and was nicely rejected.
On an hourly time frame, I spotted a confirmed breakout of a resistance line of a falling wedge pattern.
I believe that the pair may bounce soon.
Targets: 0.876 / 0.878
❤️If you have any questions, please, ask me in the comment section.
Please, support my work with like, thank you!❤️

✅My Telegram Channel: t.me/VasilyTrading
❗️YouTube Channel: youtube.com/c/VasilyTrader
✅ Facebook: facebook.com/VasilyTrading/
⭐ Get 100% Deposit Bonus: bit.ly/bestforexgoldbroker
❗️YouTube Channel: youtube.com/c/VasilyTrader
✅ Facebook: facebook.com/VasilyTrading/
⭐ Get 100% Deposit Bonus: bit.ly/bestforexgoldbroker
関連の投稿
免責事項
これらの情報および投稿は、TradingViewが提供または承認する金融、投資、取引、またはその他の種類の助言もしくは推奨であることを意図したものではなく、またこれらに該当するものでもありません。詳細は利用規約をご覧ください。