

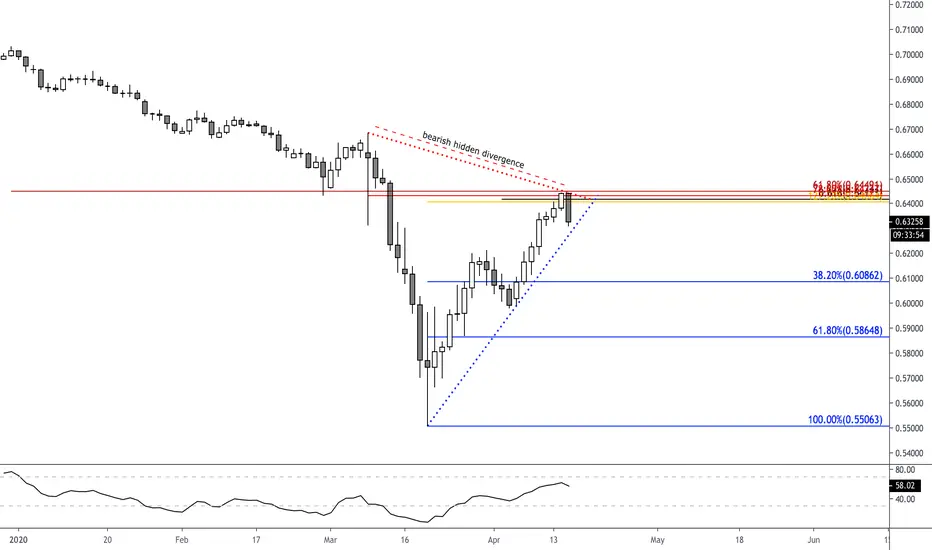
A fibonacci cluster indicates potential reversal zones, on any chart, in any market. They are used to anticipate major support/resistance levels.
In this chart the cluster is made up by 4 different levels, consisting of:
61.8% retracement (dark red)
78.6% retracement (red)
127.2% extension (golden)
0.618 projection (black)
Bearish hidden divergence, in which price forms a lower high while the oscillator is showing higher highs, confirms the short bias.
The blue levels show potential support levels.
Looks like $ is gaining strength ??
Good luck to all trading AUDUSD
In this chart the cluster is made up by 4 different levels, consisting of:
61.8% retracement (dark red)
78.6% retracement (red)
127.2% extension (golden)
0.618 projection (black)
Bearish hidden divergence, in which price forms a lower high while the oscillator is showing higher highs, confirms the short bias.
The blue levels show potential support levels.
Looks like $ is gaining strength ??
Good luck to all trading AUDUSD
ノート
Here is how the 4H timeframe looks like:ノート
This chart is very similar to NZDUSD
免責事項
これらの情報および投稿は、TradingViewが提供または承認する金融、投資、取引、またはその他の種類の助言もしくは推奨であることを意図したものではなく、またこれらに該当するものでもありません。詳細は利用規約をご覧ください。
免責事項
これらの情報および投稿は、TradingViewが提供または承認する金融、投資、取引、またはその他の種類の助言もしくは推奨であることを意図したものではなく、またこれらに該当するものでもありません。詳細は利用規約をご覧ください。