

Monthly/Weekly
Daily
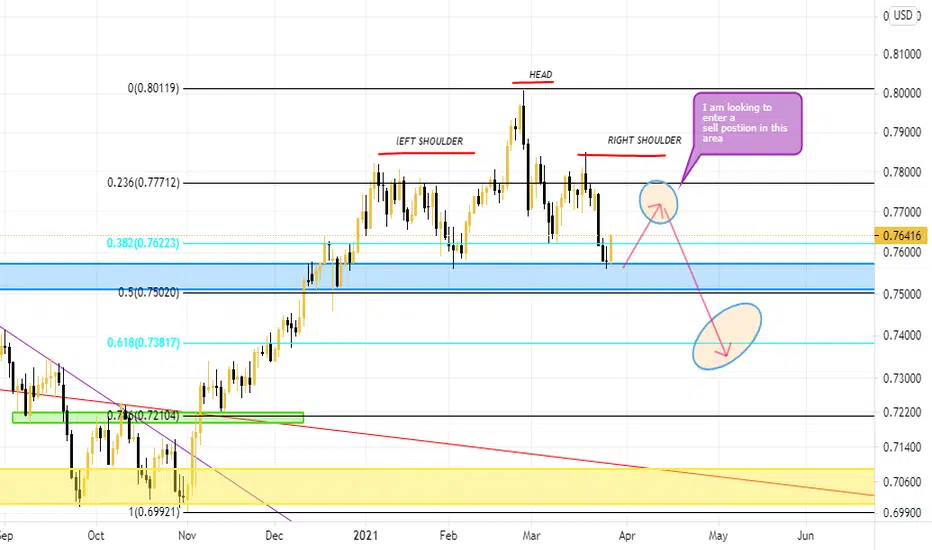
*Price has formed a Head and Shoulders (H&S) formation which is a sign of bearish pressure or a possible move to the downside.
Remember on the higher timeframe, price has been consolidating, the H&S formation on the daily is a confirmation that price is ready to drop.
I am expecting price to make one more attempt to the upside before making the bearish move to the downside.
If you draw a Fibonacci from the beginning of the right shoulder to the blue support level where price reversed, you will notice that I am expecting price to make a final push near the 50.0-61.8 fib levels, which correlates with the area arrows I drew.
Here is where I'm expecting to enter a sell position.
- -Price is clearly in an overall bullish trend.
- But price appears to have become overextended, after a huge breakout (through the trend line) and has since been consolidating preparing to make a possible pullback/retracement.
Daily
*Price has formed a Head and Shoulders (H&S) formation which is a sign of bearish pressure or a possible move to the downside.
Remember on the higher timeframe, price has been consolidating, the H&S formation on the daily is a confirmation that price is ready to drop.
I am expecting price to make one more attempt to the upside before making the bearish move to the downside.
If you draw a Fibonacci from the beginning of the right shoulder to the blue support level where price reversed, you will notice that I am expecting price to make a final push near the 50.0-61.8 fib levels, which correlates with the area arrows I drew.
Here is where I'm expecting to enter a sell position.

免責事項
これらの情報および投稿は、TradingViewが提供または承認する金融、投資、取引、またはその他の種類の助言もしくは推奨であることを意図したものではなく、またこれらに該当するものでもありません。詳細は利用規約をご覧ください。
免責事項
これらの情報および投稿は、TradingViewが提供または承認する金融、投資、取引、またはその他の種類の助言もしくは推奨であることを意図したものではなく、またこれらに該当するものでもありません。詳細は利用規約をご覧ください。