

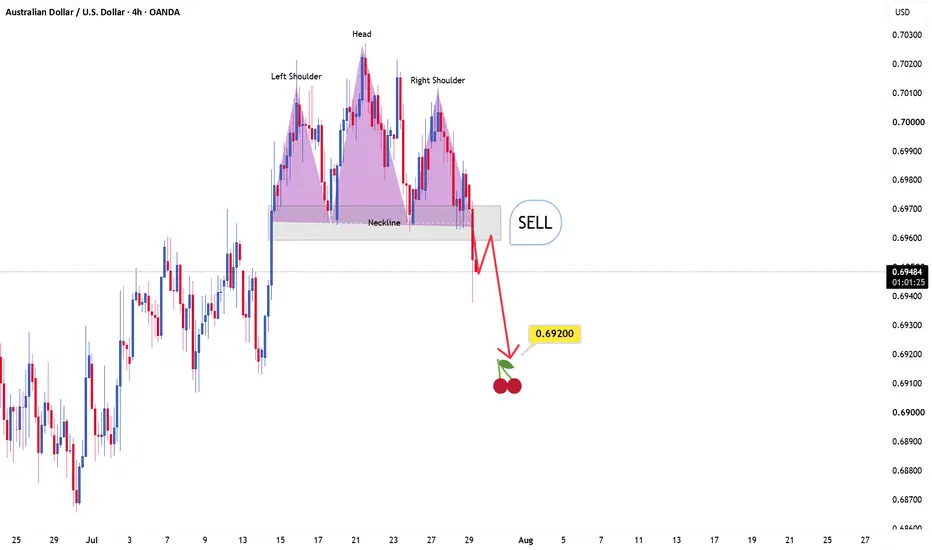
This is my AUD/USD 4-hour chart and this is how I see the current structure. After a strong move higher, price is now showing signs of exhaustion and has started forming a potential Head and Shoulders reversal pattern.
The left shoulder, head, and right shoulder are clearly visible, but the setup is not confirmed yet. The key level to watch is the neckline support. I want to see a strong break and a candle close below this area before considering any sell opportunity.
If the neckline breaks successfully, it could signal that sellers are taking control again and open the way for a move toward the 0.69200 area.
Until that confirmation happens, this is only a potential reversal pattern, not a completed setup. If buyers manage to defend the neckline and push price back higher, this idea will no longer be valid.
Entry Reasons:
The left shoulder, head, and right shoulder are clearly visible, but the setup is not confirmed yet. The key level to watch is the neckline support. I want to see a strong break and a candle close below this area before considering any sell opportunity.
If the neckline breaks successfully, it could signal that sellers are taking control again and open the way for a move toward the 0.69200 area.
Until that confirmation happens, this is only a potential reversal pattern, not a completed setup. If buyers manage to defend the neckline and push price back higher, this idea will no longer be valid.
Entry Reasons:
- Head and Shoulders reversal structure
- Strong rejection from resistance
- Possible bearish momentum shift
- Neckline breakdown confirmation needed

関連の投稿
免責事項
これらの情報および投稿は、TradingViewが提供または承認する金融、投資、取引、またはその他の種類の助言もしくは推奨であることを意図したものではなく、またこれらに該当するものでもありません。詳細は利用規約をご覧ください。
関連の投稿
免責事項
これらの情報および投稿は、TradingViewが提供または承認する金融、投資、取引、またはその他の種類の助言もしくは推奨であることを意図したものではなく、またこれらに該当するものでもありません。詳細は利用規約をご覧ください。