

Continuation of previous post :
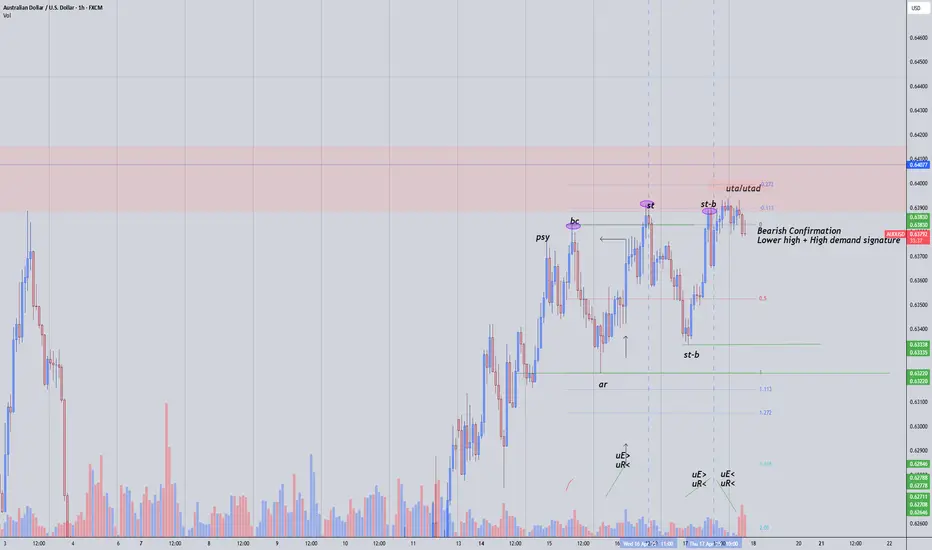
1H Range starts off this schematic by stopping the momentum at the point of the first secondary test, it fails to break the previous high and this markets goes from moving up to sideways into this TR. Each rally to previous highs reflects upside effort increasing, but upside result is decreasing indicating buyers weakness near this level. uE>, uR< = bearish indicator.
Favorable bearish confirmation would be a lower high, paired with high buy volume confirming the shift to bearish market.
1H Range starts off this schematic by stopping the momentum at the point of the first secondary test, it fails to break the previous high and this markets goes from moving up to sideways into this TR. Each rally to previous highs reflects upside effort increasing, but upside result is decreasing indicating buyers weakness near this level. uE>, uR< = bearish indicator.
Favorable bearish confirmation would be a lower high, paired with high buy volume confirming the shift to bearish market.

免責事項
これらの情報および投稿は、TradingViewが提供または承認する金融、投資、取引、またはその他の種類の助言もしくは推奨であることを意図したものではなく、またこれらに該当するものでもありません。詳細は利用規約をご覧ください。
免責事項
これらの情報および投稿は、TradingViewが提供または承認する金融、投資、取引、またはその他の種類の助言もしくは推奨であることを意図したものではなく、またこれらに該当するものでもありません。詳細は利用規約をご覧ください。