

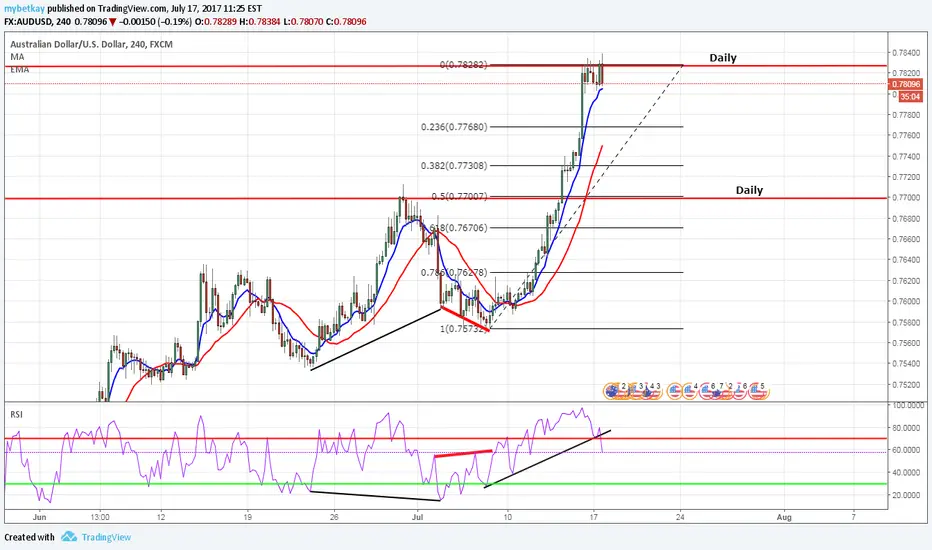
Price hit resistance level on the daily TF that was last hit in April 2016. If you scale down to the 4H TF, Price bounced off the RSI three times before crossing down. If RSI closes below the trendline, we have a chance of shorting. The resistance and support lines are based on the Daily TF.
Possible target can be at the 0.5 fib level or 0.77007
This is for educational purposes only
Possible target can be at the 0.5 fib level or 0.77007
This is for educational purposes only

免責事項
これらの情報および投稿は、TradingViewが提供または承認する金融、投資、取引、またはその他の種類の助言もしくは推奨であることを意図したものではなく、またこれらに該当するものでもありません。詳細は利用規約をご覧ください。
免責事項
これらの情報および投稿は、TradingViewが提供または承認する金融、投資、取引、またはその他の種類の助言もしくは推奨であることを意図したものではなく、またこれらに該当するものでもありません。詳細は利用規約をご覧ください。