

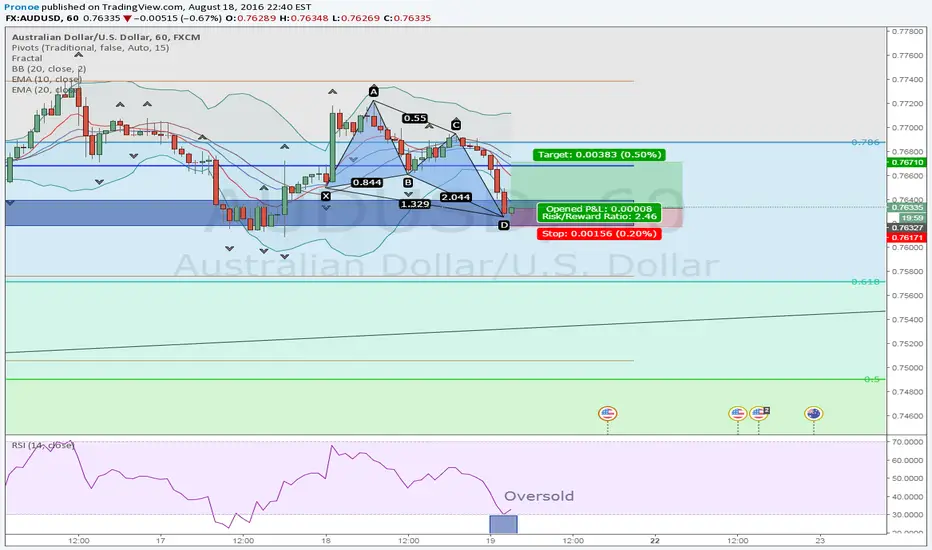
I setup my support area on a hourly chart. As the price reach the support area I noticed thanks to the RSI that the currency was oversold. On top of that I saw a nice bullish butterfly forming. I went long at 0.76332, set my S/L just below my support area and my T/P just above the pivot point. I'll take another look at what the price is doing in a few hours and might raise my T/P and S/L accordingly
手動でトレードを終了しました
I decided to close this trade earlier because I was starting to think that it started to really look like the 4th wave of an elliott wave. I will keep monitoring this currencies pair to maybe go short at the top of wave 5
免責事項
これらの情報および投稿は、TradingViewが提供または承認する金融、投資、取引、またはその他の種類の助言もしくは推奨であることを意図したものではなく、またこれらに該当するものでもありません。詳細は利用規約をご覧ください。
免責事項
これらの情報および投稿は、TradingViewが提供または承認する金融、投資、取引、またはその他の種類の助言もしくは推奨であることを意図したものではなく、またこれらに該当するものでもありません。詳細は利用規約をご覧ください。