

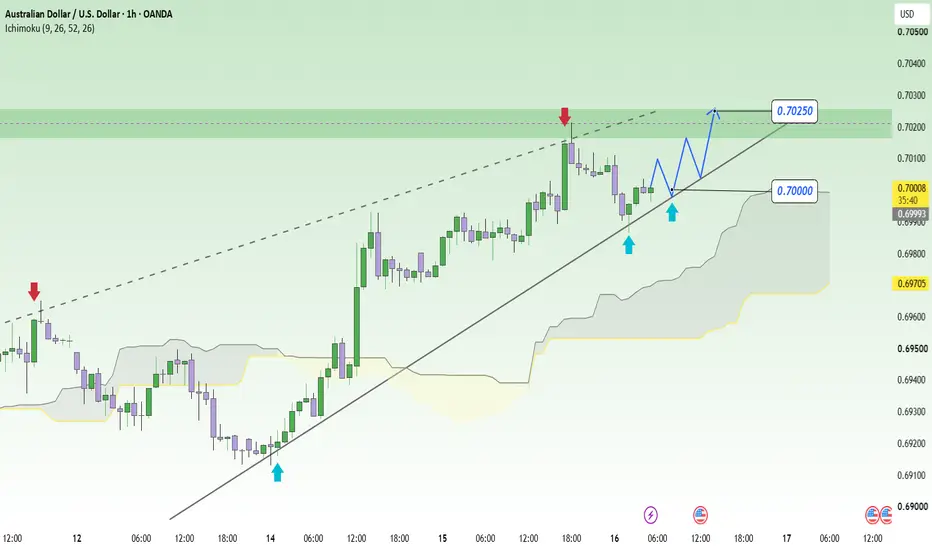
AUDUSD is maintaining a clear bullish structure on the H1 timeframe. Following a strong breakout from the 0.6940 level, the price has consistently formed higher lows, supported by an upward trendline extending from the July 14 low. The most recent pullback to the 0.6990–0.7000 range quickly attracted buying interest, indicating that buyers are defending the structure.
The price currently remains above the Ichimoku Cloud, while dynamic support levels continue to slope upward. This suggests that the current dip is primarily a retest rather than a reversal signal. If the 0.7000 level holds, AUDUSD is likely to retest the 0.7020–0.7025 zone, where selling pressure was previously observed.
On the macro front, the AUD is supported by the RBA maintaining the cash rate at 4.35% following a hike in May aimed at curbing inflation. Meanwhile, pressure on the USD is mounting as markets scale back expectations for further Fed tightening. However, slowing growth in China remains a factor that could limit the AUD's strength.
Suggested strategy: Prioritize buying if the price holds the 0.6995–0.7000 range and a bullish confirmation signal appears. Target: 0.7025; the bullish scenario would weaken if the price closes clearly below the trendline on the H1 chart.
The price currently remains above the Ichimoku Cloud, while dynamic support levels continue to slope upward. This suggests that the current dip is primarily a retest rather than a reversal signal. If the 0.7000 level holds, AUDUSD is likely to retest the 0.7020–0.7025 zone, where selling pressure was previously observed.
On the macro front, the AUD is supported by the RBA maintaining the cash rate at 4.35% following a hike in May aimed at curbing inflation. Meanwhile, pressure on the USD is mounting as markets scale back expectations for further Fed tightening. However, slowing growth in China remains a factor that could limit the AUD's strength.
Suggested strategy: Prioritize buying if the price holds the 0.6995–0.7000 range and a bullish confirmation signal appears. Target: 0.7025; the bullish scenario would weaken if the price closes clearly below the trendline on the H1 chart.

LEVEL UP YOUR TRADING
👉t.me/+aoROTvcQl3k4MzA1
Signals & setups to boost your edge
Free trading plans to follow
Real-time market insights
👉t.me/+aoROTvcQl3k4MzA1
Signals & setups to boost your edge
Free trading plans to follow
Real-time market insights
関連の投稿
免責事項
これらの情報および投稿は、TradingViewが提供または承認する金融、投資、取引、またはその他の種類の助言もしくは推奨であることを意図したものではなく、またこれらに該当するものでもありません。詳細は利用規約をご覧ください。
LEVEL UP YOUR TRADING
👉t.me/+aoROTvcQl3k4MzA1
Signals & setups to boost your edge
Free trading plans to follow
Real-time market insights
👉t.me/+aoROTvcQl3k4MzA1
Signals & setups to boost your edge
Free trading plans to follow
Real-time market insights
関連の投稿
免責事項
これらの情報および投稿は、TradingViewが提供または承認する金融、投資、取引、またはその他の種類の助言もしくは推奨であることを意図したものではなく、またこれらに該当するものでもありません。詳細は利用規約をご覧ください。