

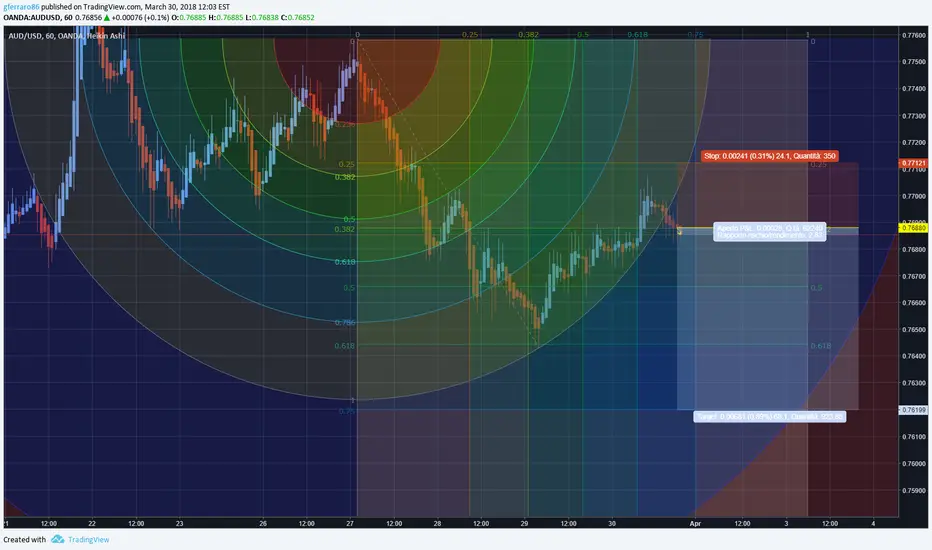
AUDUSD short
ノート
The idea is really easy and completely based on math. The audusd graph is actually a downtrend. I used the Fibonacci half circle to identify interesting price levels where the price has moved in the near past and where it's still reacting now. As soon as the price, after jumping up and down inside the tunnel, broken down again I opened a sell position. I also used the gann square to identify my target points and my stop loss. Really basic reference points. You can Easley find all the interesting points onthe graph I've shared
免責事項
これらの情報および投稿は、TradingViewが提供または承認する金融、投資、取引、またはその他の種類の助言もしくは推奨であることを意図したものではなく、またこれらに該当するものでもありません。詳細は利用規約をご覧ください。
免責事項
これらの情報および投稿は、TradingViewが提供または承認する金融、投資、取引、またはその他の種類の助言もしくは推奨であることを意図したものではなく、またこれらに該当するものでもありません。詳細は利用規約をご覧ください。