
CHART SUMMARY
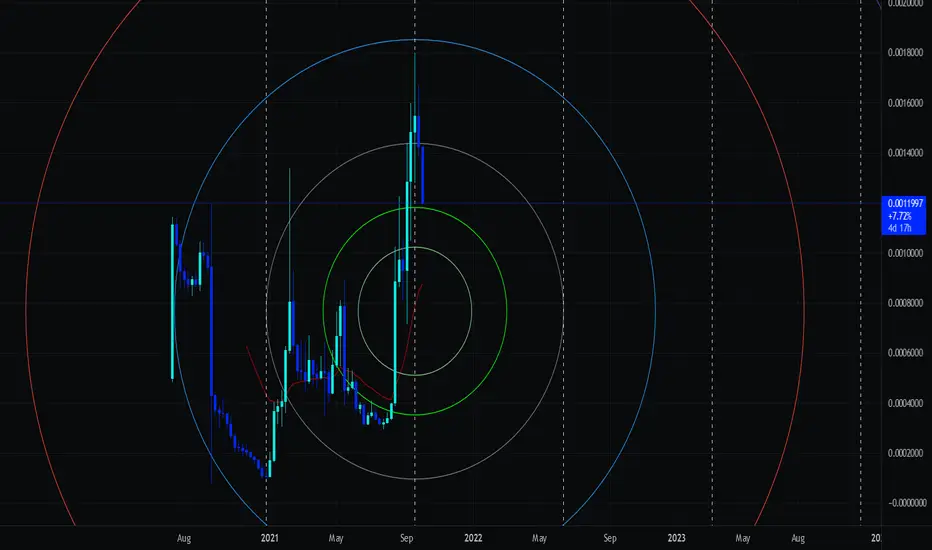
Binance - Weekly Candles - AVAX/BTC
CHART OVERVIEW
Fibbonaci Circles: from the centre outwards = 0.382, 0.618, 1, 1.618, 2.618, 3.618.
ANALYSIS
The price is heading towards the green 0.618 circle, this is a pivotal price point and could indicate a bullish bounce is upcoming.
CONCLUSSION
If lots of volume and a sharp rise occurs after contacting the 0.618 circle this is looking bullish, if price drops through and lingers below it's looking bearish.
What do you guys think, bullish or bearish? Personally I'm bullish based on fundamentals and price action.
*DISCLAIMER: NOT PROFESSIONAL ADVICE
ノート
Incredible recovery from AVAX to reach a new ATH. I expect a retracement at this point to approximately 0.00115 as there seems to be a lot of support at this area, after that it could resume it's bull run, this coin could have a lot of potential.
免責事項
これらの情報および投稿は、TradingViewが提供または承認する金融、投資、取引、またはその他の種類の助言もしくは推奨であることを意図したものではなく、またこれらに該当するものでもありません。詳細は利用規約をご覧ください。
免責事項
これらの情報および投稿は、TradingViewが提供または承認する金融、投資、取引、またはその他の種類の助言もしくは推奨であることを意図したものではなく、またこれらに該当するものでもありません。詳細は利用規約をご覧ください。