
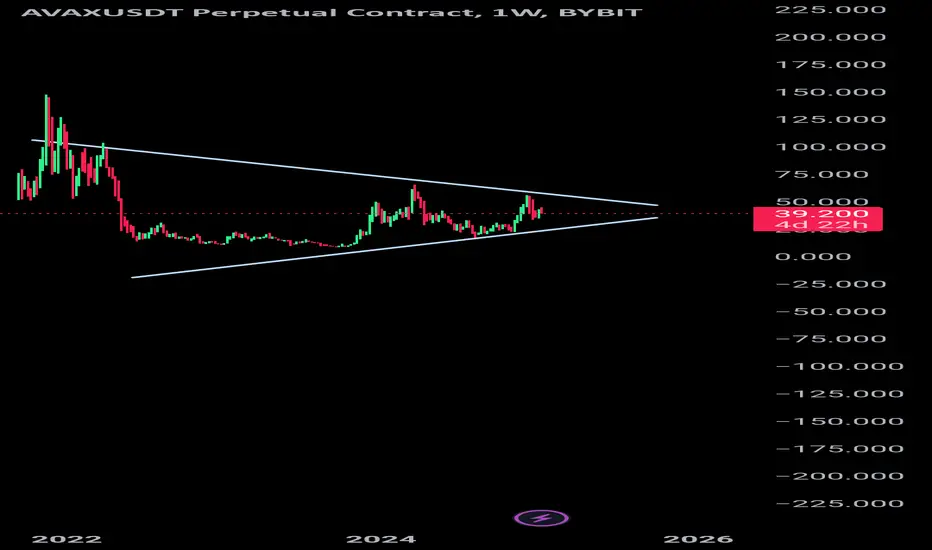
The chart illustrates a classic symmetrical triangle pattern on the weekly timeframe, suggesting a period of consolidation before a potential breakout. The price is holding above the 50-week moving average (MA50), reinforcing the bullish outlook.
Key Observations
The symmetrical triangle indicates indecision in the market, with buyers and sellers converging.
Holding above the MA50 signals strong support and a likelihood of upward momentum.
A confirmed breakout above the upper trendline will validate the bullish scenario and trigger significant upward movement.
Targets Upon Breakout
$61 - $149
Strategic Implications
Patience is key. Monitor for a breakout with strong volume confirmation above the triangle's resistance. Failure to break out may result in continued consolidation within the pattern. This setup offers significant potential for medium to long-term gains if the breakout materializes.

免責事項
これらの情報および投稿は、TradingViewが提供または承認する金融、投資、取引、またはその他の種類の助言もしくは推奨であることを意図したものではなく、またこれらに該当するものでもありません。詳細は利用規約をご覧ください。
免責事項
これらの情報および投稿は、TradingViewが提供または承認する金融、投資、取引、またはその他の種類の助言もしくは推奨であることを意図したものではなく、またこれらに該当するものでもありません。詳細は利用規約をご覧ください。