
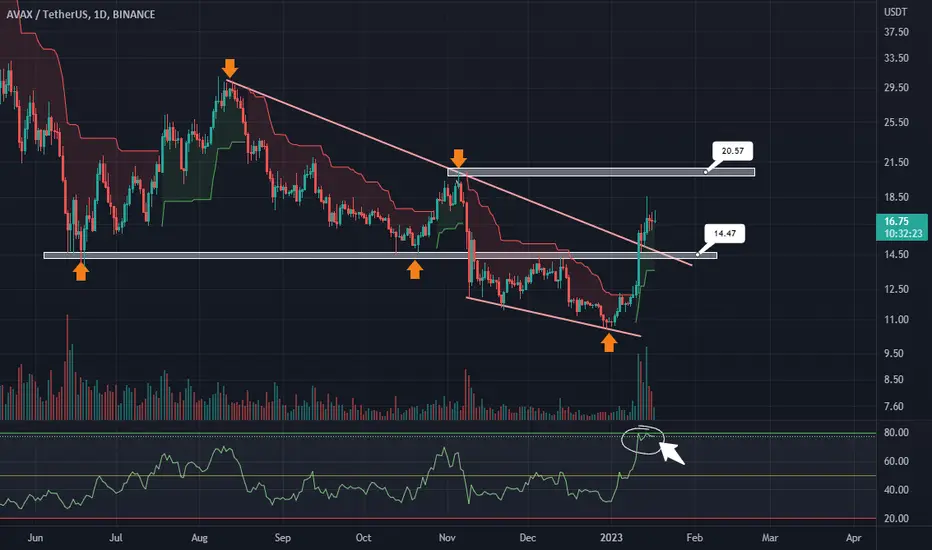
Here we can the daily chart of "AVAXUSDT" it has a horizontal SUPPORT at "14.47" and a horizontal RESISTANCE at "20.57". As we can see the candle already has taken breakout from the trendline with a high volume and if the candle retests the support zone then we can definetly look for a long opportunity from that zone and can expect a terget of "20.57" till then keep an eye on the support zone. And you can also see that the chart is making a double bottom and the pattern gets complete ot the resistance "20.57". Make trade ENTRY at the "14.47" zone with a TIGHT STOPLOSS at "13.90" and the TARGET ZONE at "20.57".
ENJOY !!!
ENJOY !!!

免責事項
これらの情報および投稿は、TradingViewが提供または承認する金融、投資、取引、またはその他の種類の助言もしくは推奨であることを意図したものではなく、またこれらに該当するものでもありません。詳細は利用規約をご覧ください。
免責事項
これらの情報および投稿は、TradingViewが提供または承認する金融、投資、取引、またはその他の種類の助言もしくは推奨であることを意図したものではなく、またこれらに該当するものでもありません。詳細は利用規約をご覧ください。