
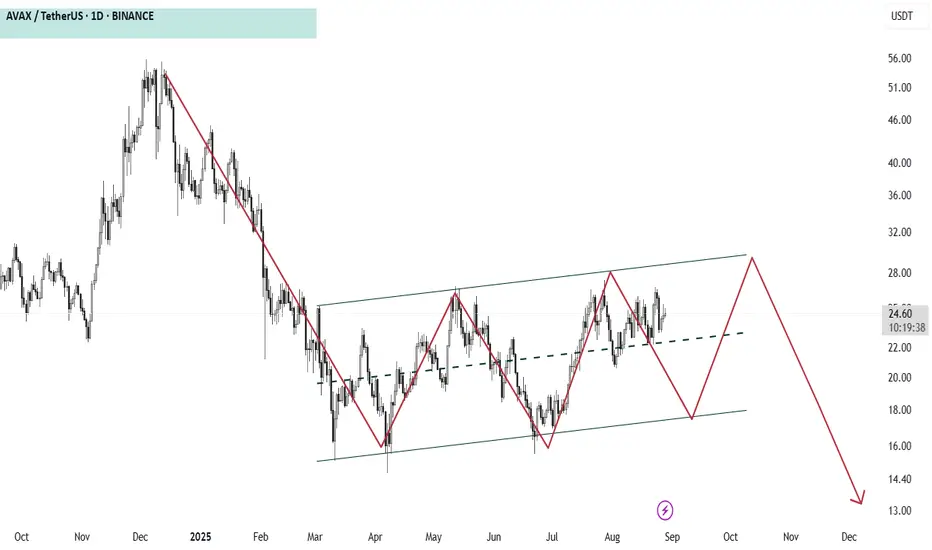
The chart of AVAX/USDT shows a rising channel that has been forming since March 2025. Price is moving up and down inside this channel, making lower highs and higher lows in a zig-zag pattern.
The projection suggests that after testing the upper side of the channel near $28, the price may fall back to the lower boundary around $18, and eventually break down towards $13–14.
This pattern indicates that while the market is still respecting the channel for now, the overall expectation is a bearish breakout in the medium term.
What do you think ?
The projection suggests that after testing the upper side of the channel near $28, the price may fall back to the lower boundary around $18, and eventually break down towards $13–14.
This pattern indicates that while the market is still respecting the channel for now, the overall expectation is a bearish breakout in the medium term.
What do you think ?

免責事項
これらの情報および投稿は、TradingViewが提供または承認する金融、投資、取引、またはその他の種類の助言もしくは推奨であることを意図したものではなく、またこれらに該当するものでもありません。詳細は利用規約をご覧ください。
免責事項
これらの情報および投稿は、TradingViewが提供または承認する金融、投資、取引、またはその他の種類の助言もしくは推奨であることを意図したものではなく、またこれらに該当するものでもありません。詳細は利用規約をご覧ください。