
Hi everyone,
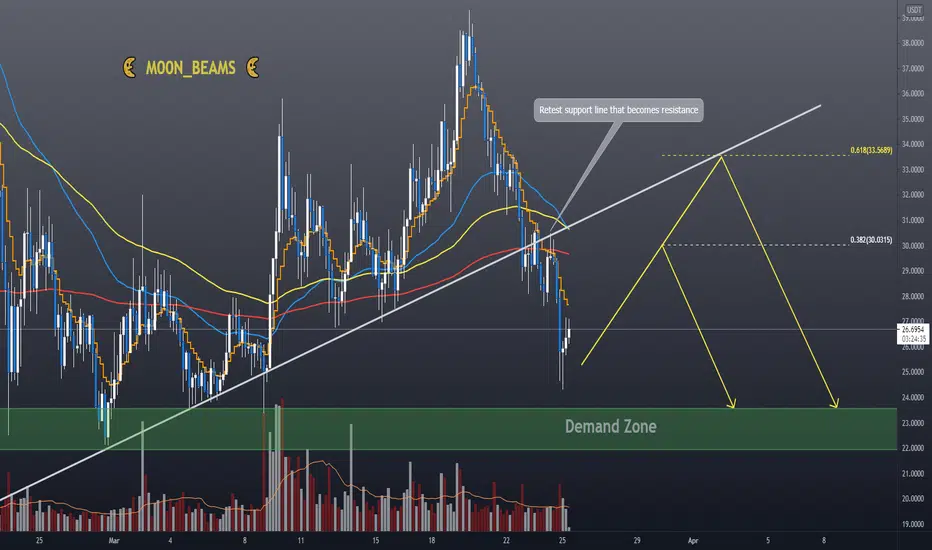
Two days ago we saw AVAX testing and failing its support trend line. The break-out to the bottom side was confirmed when retesting the support trend line that acted as resistance. When looking at the price action, bearish signals were in play (shooting start & engulfing candles).
As highlighted in the chart there is a possibility to fall lower to the indicated demand zone. This zone has been tested several time and acts as a strong support.
As these corrections are normal market cycles, I am stull bullish on Avalanche in the long run!
🌜 Please like and leave a comment 🌜
This is not financial advice
Two days ago we saw AVAX testing and failing its support trend line. The break-out to the bottom side was confirmed when retesting the support trend line that acted as resistance. When looking at the price action, bearish signals were in play (shooting start & engulfing candles).
As highlighted in the chart there is a possibility to fall lower to the indicated demand zone. This zone has been tested several time and acts as a strong support.
As these corrections are normal market cycles, I am stull bullish on Avalanche in the long run!
🌜 Please like and leave a comment 🌜
This is not financial advice
ノート
Demand zone re-tested.Let's see if the bounce is strong enough to continue to the upside.
Update will follow

免責事項
これらの情報および投稿は、TradingViewが提供または承認する金融、投資、取引、またはその他の種類の助言もしくは推奨であることを意図したものではなく、またこれらに該当するものでもありません。詳細は利用規約をご覧ください。
免責事項
これらの情報および投稿は、TradingViewが提供または承認する金融、投資、取引、またはその他の種類の助言もしくは推奨であることを意図したものではなく、またこれらに該当するものでもありません。詳細は利用規約をご覧ください。