
Disclaimer:
This analysis is for educational purposes only. I am not a SEBI-registered advisor. This is not financial advice.
Educational Case Study | 1 April 2024
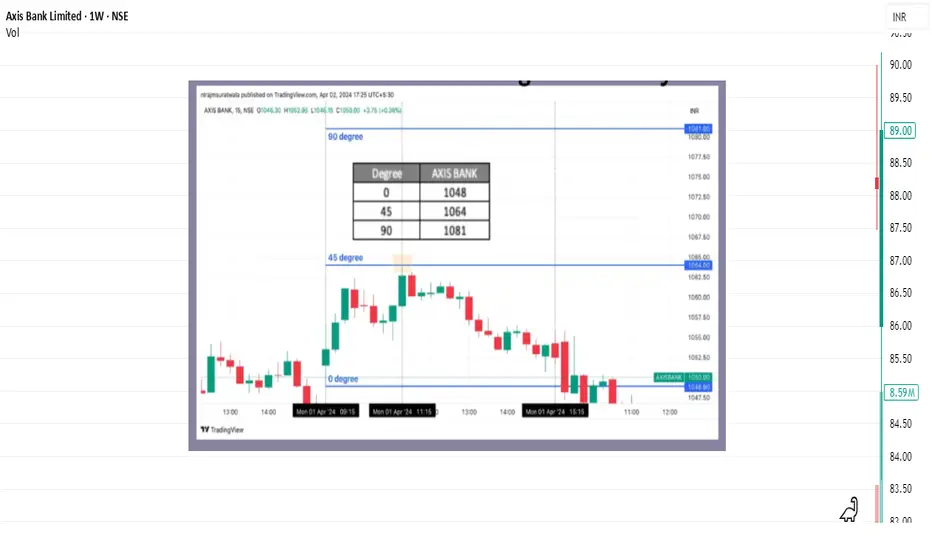
This idea shares an educational intraday case study on Axis Bank, focusing on how price capacity and time awareness were observed using square-based geometric methods discussed in classical market studies.
The objective is to study historical chart behavior, not to suggest trades or outcomes.
📊 Chart Context
Instrument: Axis Bank Ltd. (NSE)
Date: 1 April 2024
Timeframe: 15-minute (Intraday)
During the early part of the session, Axis Bank showed upward movement. A structured framework was applied to observe how price interacted with predefined reference levels as the session progressed.
🔍 Observational Framework Used
All levels were considered potential reaction zones, not fixed resistance points.
📈 Observed Intraday Behavior
This observation aligns with how price has historically interacted with similar geometric areas.
📘 Educational Takeaways
📌 Important Note
This case study is shared strictly for learning and research purposes.
Geometric levels and time windows do not guarantee outcomes and should be treated as contextual analytical tools.
Market behavior may include:
🚀 Summary
This intraday case study demonstrates how price geometry and time alignment can be used to observe market behavior objectively and systematically.
More educational chart studies will follow.
This analysis is for educational purposes only. I am not a SEBI-registered advisor. This is not financial advice.
Educational Case Study | 1 April 2024
This idea shares an educational intraday case study on Axis Bank, focusing on how price capacity and time awareness were observed using square-based geometric methods discussed in classical market studies.
The objective is to study historical chart behavior, not to suggest trades or outcomes.
📊 Chart Context
Instrument: Axis Bank Ltd. (NSE)
Date: 1 April 2024
Timeframe: 15-minute (Intraday)
During the early part of the session, Axis Bank showed upward movement. A structured framework was applied to observe how price interacted with predefined reference levels as the session progressed.
🔍 Observational Framework Used
- The low of the initial intraday structure was treated as a reference point (around 1048)
- From this reference, square-based projections were observed
- A level near 1064 aligned with a 45-degree projection, often associated with normal intraday price reach in historical studies
- A higher projection was noted only as a contextual boundary, not an expectation
All levels were considered potential reaction zones, not fixed resistance points.
📈 Observed Intraday Behavior
- Price gradually moved toward the projected zone during the session
- Near this area, the market showed temporary pressure and difficulty sustaining above the level
- A short-term response was observed around the projected zone
- Minor price variation around the level was consistent with normal market behavior
This observation aligns with how price has historically interacted with similar geometric areas.
📘 Educational Takeaways
- Square-based geometry can help outline logical intraday price capacity
- The 45-degree projection often acts as an area of interest, not a precise barrier
- Time awareness adds structure when observing intraday movement
- Small deviations around projected zones are normal and expected
- This approach encourages rule-based observation rather than precision fixation
📌 Important Note
This case study is shared strictly for learning and research purposes.
Geometric levels and time windows do not guarantee outcomes and should be treated as contextual analytical tools.
Market behavior may include:
- Temporary pauses
- Short-term pressure
- Continuation or expansion depending on broader structure
🚀 Summary
This intraday case study demonstrates how price geometry and time alignment can be used to observe market behavior objectively and systematically.
More educational chart studies will follow.

関連の投稿
免責事項
これらの情報および投稿は、TradingViewが提供または承認する金融、投資、取引、またはその他の種類の助言もしくは推奨であることを意図したものではなく、またこれらに該当するものでもありません。詳細は利用規約をご覧ください。
関連の投稿
免責事項
これらの情報および投稿は、TradingViewが提供または承認する金融、投資、取引、またはその他の種類の助言もしくは推奨であることを意図したものではなく、またこれらに該当するものでもありません。詳細は利用規約をご覧ください。