
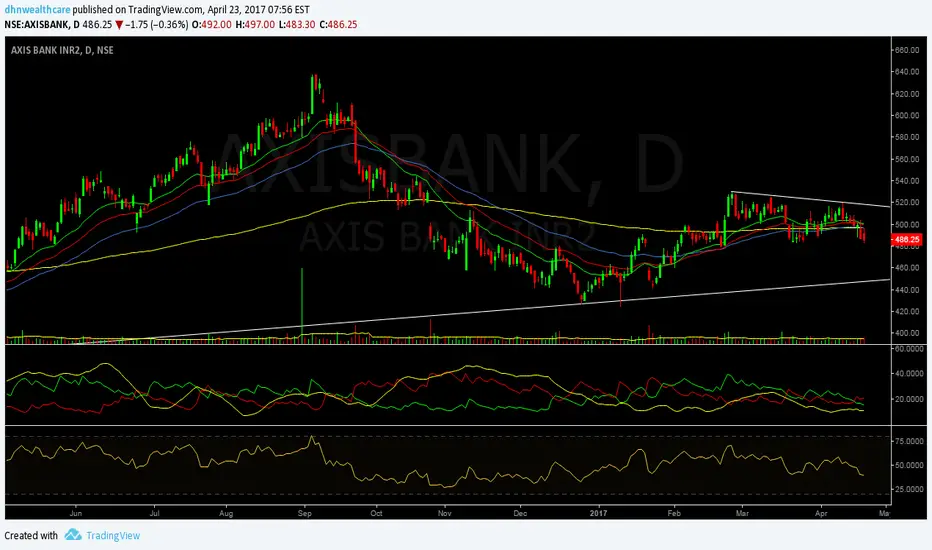
Chart of Axis Bank is suggesting weakness in stock price in coming days. Stock has closed below all short and long term moving averages. Additionally RSI and ADX has given negative divergence on both daily as well as weekly charts.
One can initiate short position on stock between 483-487 levels with stop loss of 521 (last up swing move) for target of 450 in coming 4-6 weeks.
One can initiate short position on stock between 483-487 levels with stop loss of 521 (last up swing move) for target of 450 in coming 4-6 weeks.

免責事項
これらの情報および投稿は、TradingViewが提供または承認する金融、投資、取引、またはその他の種類の助言もしくは推奨であることを意図したものではなく、またこれらに該当するものでもありません。詳細は利用規約をご覧ください。
免責事項
これらの情報および投稿は、TradingViewが提供または承認する金融、投資、取引、またはその他の種類の助言もしくは推奨であることを意図したものではなく、またこれらに該当するものでもありません。詳細は利用規約をご覧ください。