
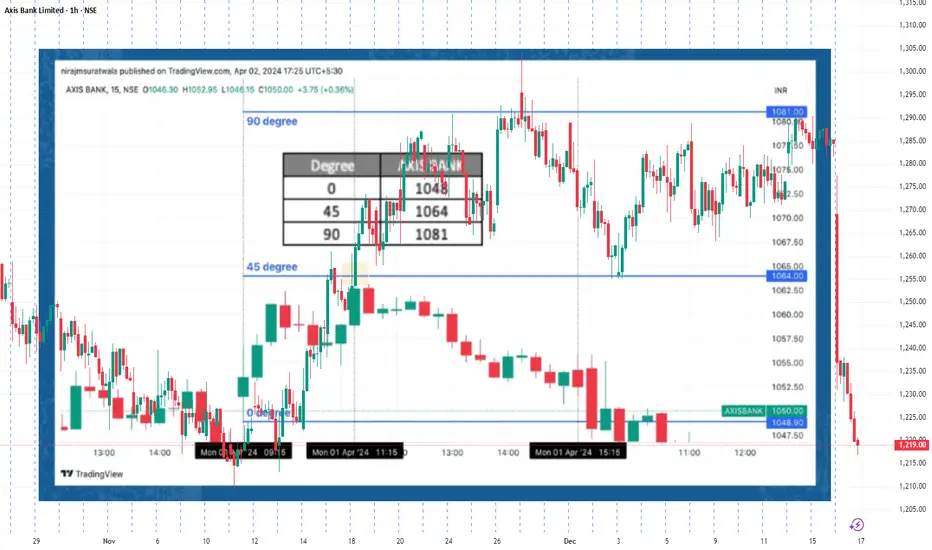
This idea presents an intraday case study demonstrating how WD Gann’s Square of 9 can be applied to identify probable resistance zones using price–angle relationships.
On 01 April 2024, Axis Bank showed early intraday strength after the opening session.
The first 15-minute low was used as the 0-degree reference point, following classical Gann methodology.
Based on Square of 9 calculations, the following projected levels were derived:
• 45° level (normal intraday capacity) → 1064
• 90° level (expanded / rare capacity) → 1081
As price advanced during the session, it approached the 45-degree level before the late-session time window. Around this zone, price showed clear hesitation and rejection, followed by intraday weakness.
🔍 Key Observations from This Study
• Use the first intraday pivot to define the 0-degree base
• Calculate angle-based projections using Square of 9 logic
• Observe time alignment when price reaches projected levels
• Reactions near 45° often indicate normal resistance behaviour
This example highlights how rule-based price geometry helps traders study intraday behaviour in a structured and disciplined way, without relying on indicators.
Disclaimer:
This post is shared strictly for educational and chart-analysis purposes only.
It is not a trading recommendation or financial advice.
On 01 April 2024, Axis Bank showed early intraday strength after the opening session.
The first 15-minute low was used as the 0-degree reference point, following classical Gann methodology.
Based on Square of 9 calculations, the following projected levels were derived:
• 45° level (normal intraday capacity) → 1064
• 90° level (expanded / rare capacity) → 1081
As price advanced during the session, it approached the 45-degree level before the late-session time window. Around this zone, price showed clear hesitation and rejection, followed by intraday weakness.
🔍 Key Observations from This Study
• Use the first intraday pivot to define the 0-degree base
• Calculate angle-based projections using Square of 9 logic
• Observe time alignment when price reaches projected levels
• Reactions near 45° often indicate normal resistance behaviour
This example highlights how rule-based price geometry helps traders study intraday behaviour in a structured and disciplined way, without relying on indicators.
Disclaimer:
This post is shared strictly for educational and chart-analysis purposes only.
It is not a trading recommendation or financial advice.

関連の投稿
免責事項
これらの情報および投稿は、TradingViewが提供または承認する金融、投資、取引、またはその他の種類の助言もしくは推奨であることを意図したものではなく、またこれらに該当するものでもありません。詳細は利用規約をご覧ください。
免責事項
これらの情報および投稿は、TradingViewが提供または承認する金融、投資、取引、またはその他の種類の助言もしくは推奨であることを意図したものではなく、またこれらに該当するものでもありません。詳細は利用規約をご覧ください。