
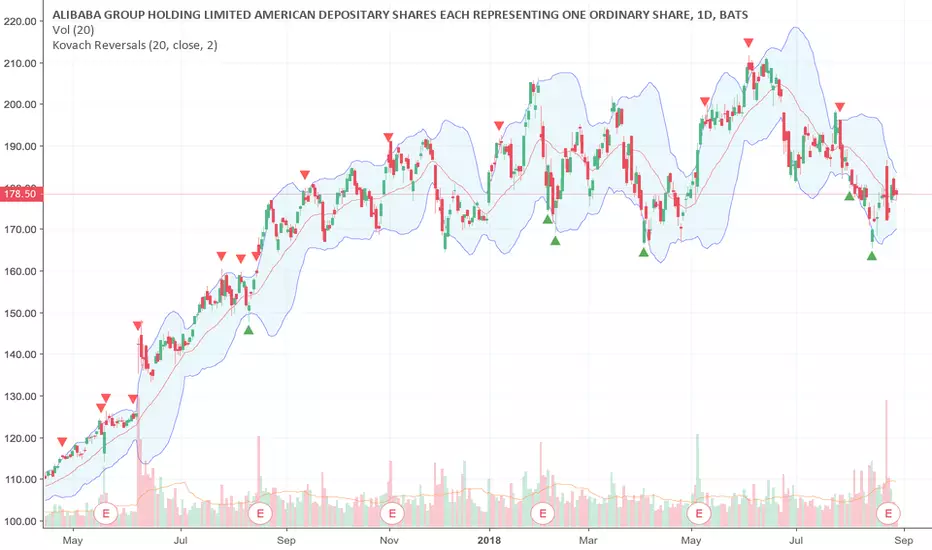
Although the technicals for BABA seem to be bearish, we don't have a lot of conviction.
BABA is trading at $178.49, at the moment.
We will find resistance from levels from above including the following:
178.90 from volume profile over the past 14 periods
179.53 from volume profile over the past 14 periods
180.38 from volume profile over the past 14 periods
181.95 from gaps
182.38 from volume profile over the past 14 periods
182.90 from gaps
183.54 from volume profile over the past 14 periods
183.96 from gaps
184.51 from volume profile over the past 30 periods
185.46 from sma 50
Levels from below will provide support, including:
177.00 from gaps
176.20 from gaps
174.79 from gaps
174.20 from gaps
173.85 from gaps
172.41 from gaps
172.05 from gaps
171.29 from gaps
170.77 from gaps
169.85 from gaps
Technical analysis for BABA is as follows. Volatility is higher than usual, but still has room to go. The RSI is 48, indicating that we are in a bear trend, but not yet oversold. The MACD is above the signal line, but not to an extreme. This suggests we may have more room to appreciate. The 50 period SMA indicates that we are in a bear trend. Additionally, BABA is below the 100 period SMA, which indicates a bear trend, but not oversold yet. Finally, the 50 period SMA is below the 100 period SMA, which is a longer term confirmation of bearishness. The ADX does not indicate a trend, i.e. we are ranging.
BABA is trading at $178.49, at the moment.
We will find resistance from levels from above including the following:
178.90 from volume profile over the past 14 periods
179.53 from volume profile over the past 14 periods
180.38 from volume profile over the past 14 periods
181.95 from gaps
182.38 from volume profile over the past 14 periods
182.90 from gaps
183.54 from volume profile over the past 14 periods
183.96 from gaps
184.51 from volume profile over the past 30 periods
185.46 from sma 50
Levels from below will provide support, including:
177.00 from gaps
176.20 from gaps
174.79 from gaps
174.20 from gaps
173.85 from gaps
172.41 from gaps
172.05 from gaps
171.29 from gaps
170.77 from gaps
169.85 from gaps
Technical analysis for BABA is as follows. Volatility is higher than usual, but still has room to go. The RSI is 48, indicating that we are in a bear trend, but not yet oversold. The MACD is above the signal line, but not to an extreme. This suggests we may have more room to appreciate. The 50 period SMA indicates that we are in a bear trend. Additionally, BABA is below the 100 period SMA, which indicates a bear trend, but not oversold yet. Finally, the 50 period SMA is below the 100 period SMA, which is a longer term confirmation of bearishness. The ADX does not indicate a trend, i.e. we are ranging.

Join my discord at discord.io/quantguy
免責事項
これらの情報および投稿は、TradingViewが提供または承認する金融、投資、取引、またはその他の種類の助言もしくは推奨であることを意図したものではなく、またこれらに該当するものでもありません。詳細は利用規約をご覧ください。
Join my discord at discord.io/quantguy
免責事項
これらの情報および投稿は、TradingViewが提供または承認する金融、投資、取引、またはその他の種類の助言もしくは推奨であることを意図したものではなく、またこれらに該当するものでもありません。詳細は利用規約をご覧ください。