
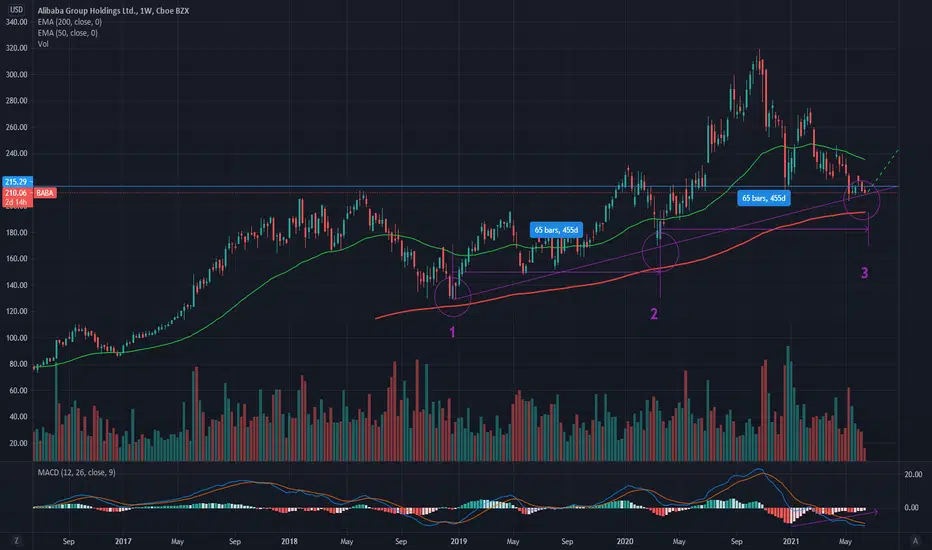
I am looking at BABA chart with MA200-day, MA50-day, MACD and Volume.
(Best to move chart to Week and Month to see clear MA proof)
It's interesting how BABA build candle over-and-over the green MA50.
I see 1-2-3 hits over the MA200 with upwards trend, looking for the date range,
we can see they're same numbers of days 455d/ 65bars.
I am looking forward to see a clear stock growth.
I am looking also to MACD and see an upwards trend.
(This is my way of thinking, please be carefully how you invest)
(Best to move chart to Week and Month to see clear MA proof)
It's interesting how BABA build candle over-and-over the green MA50.
I see 1-2-3 hits over the MA200 with upwards trend, looking for the date range,
we can see they're same numbers of days 455d/ 65bars.
I am looking forward to see a clear stock growth.
I am looking also to MACD and see an upwards trend.
(This is my way of thinking, please be carefully how you invest)

免責事項
これらの情報および投稿は、TradingViewが提供または承認する金融、投資、取引、またはその他の種類の助言もしくは推奨であることを意図したものではなく、またこれらに該当するものでもありません。詳細は利用規約をご覧ください。
免責事項
これらの情報および投稿は、TradingViewが提供または承認する金融、投資、取引、またはその他の種類の助言もしくは推奨であることを意図したものではなく、またこれらに該当するものでもありません。詳細は利用規約をご覧ください。