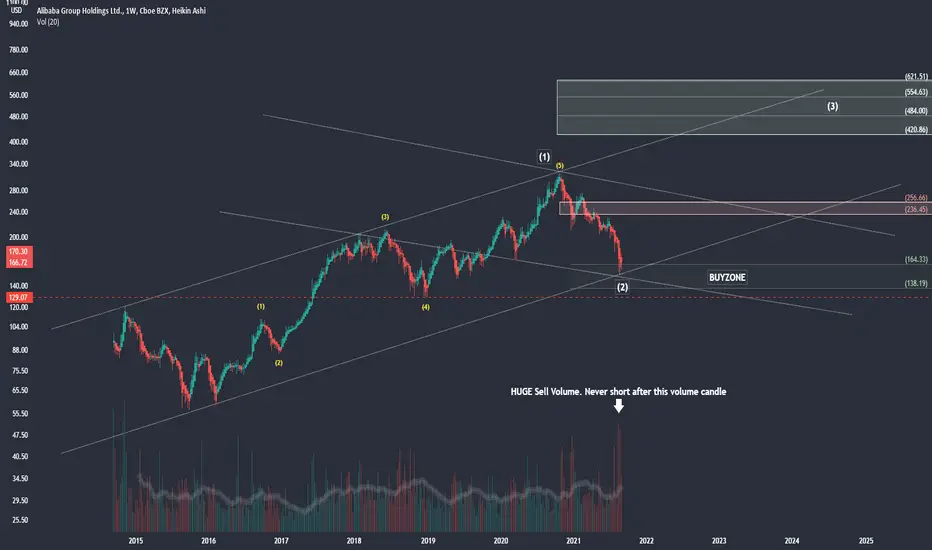
Let's examine #BABA from a weekly time frame (log scale view):
1) Respected long term channel. We now have three weekly wick up candles holding above the 164.33 level.
2) VOLUME: And this is important, we can see the volume from the weekly candle three weeks ago was HUGE. Sell volume since has been declining and we have a spinning top candle for the week ending 9/3/21. When looking for entry (which I am okay starting a position here) we want to see either the selling volume continue to decline or a buy volume candle while price holds previous low or takes out the high of previous candle.
3) We can see BABA completed a 5 wave sequence which will now become our major 1 wave. The drop in BABA is a major 2 wave correction which I want to see hold above the red dash line (minor wave 4 low - below this would be my stop loss on a weekly candle close).
The bottom green box is my buyzone where I am happy to accumulate BABA in shares or June 2023 ATM or ITM calls. Middle red box is a "trim zone" for me where I will look to eliminate as much of my cost basis as possible for a risk free trade. Based on the low two weeks ago, (if that low holds), this would be a typical bounce area for BABA before a possible retrace. This could be done in a micro wave 5 fashion, double bottom, or an S curve type pattern.
Upper green box is my major wave 3 target assuming the low is in for now on BABA.
Best of luck and hope this helps!
#BABA BABA
1) Respected long term channel. We now have three weekly wick up candles holding above the 164.33 level.
2) VOLUME: And this is important, we can see the volume from the weekly candle three weeks ago was HUGE. Sell volume since has been declining and we have a spinning top candle for the week ending 9/3/21. When looking for entry (which I am okay starting a position here) we want to see either the selling volume continue to decline or a buy volume candle while price holds previous low or takes out the high of previous candle.
3) We can see BABA completed a 5 wave sequence which will now become our major 1 wave. The drop in BABA is a major 2 wave correction which I want to see hold above the red dash line (minor wave 4 low - below this would be my stop loss on a weekly candle close).
The bottom green box is my buyzone where I am happy to accumulate BABA in shares or June 2023 ATM or ITM calls. Middle red box is a "trim zone" for me where I will look to eliminate as much of my cost basis as possible for a risk free trade. Based on the low two weeks ago, (if that low holds), this would be a typical bounce area for BABA before a possible retrace. This could be done in a micro wave 5 fashion, double bottom, or an S curve type pattern.
Upper green box is my major wave 3 target assuming the low is in for now on BABA.
Best of luck and hope this helps!
#BABA
BABA
免責事項
これらの情報および投稿は、TradingViewが提供または承認する金融、投資、取引、またはその他の種類の助言もしくは推奨であることを意図したものではなく、またこれらに該当するものでもありません。詳細は利用規約をご覧ください。
免責事項
これらの情報および投稿は、TradingViewが提供または承認する金融、投資、取引、またはその他の種類の助言もしくは推奨であることを意図したものではなく、またこれらに該当するものでもありません。詳細は利用規約をご覧ください。