
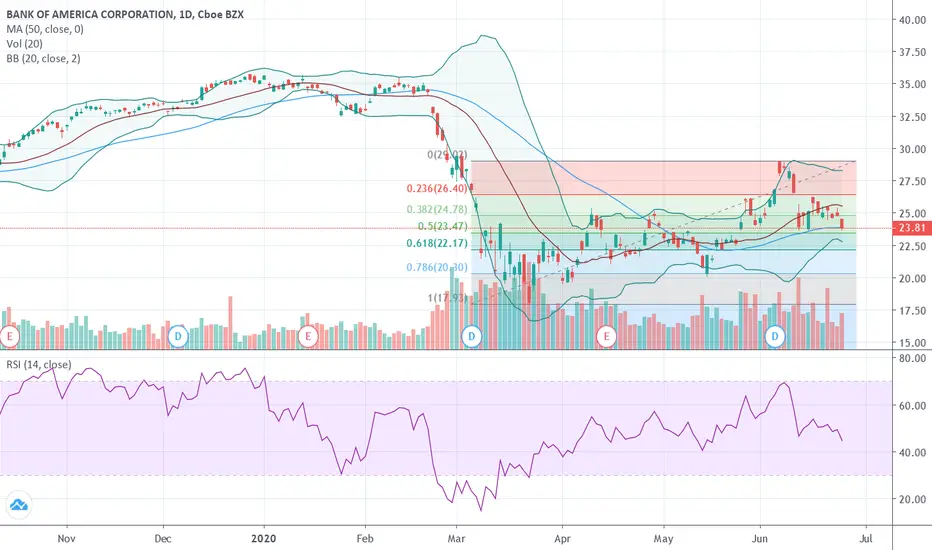
Hello Everyone! Today quite a weird close for BAC few cents below its 50 moving average, this moving average sustained the price action since the lows of March, is this behaviour a sign of weakness ? It might be, as it had all chances to close above this level and it finished below.
Price is trading in an important area, very close to the 50% Fibonacci retracement, it might take any direction.
For north direction we have to see closing above the 50 moving average (23,87) to show signs of bullishness, for south direction watch the next hourly close below that level tomorrow.
Thanks for reading and post a comment if you like to do that and....may the market be with us!
ノート
The history is repeating : price bounced again from its 50 sma. Not only : the daily candle is a bullish engulfing, a bullish signal that most of the time do not need further confirmation
免責事項
これらの情報および投稿は、TradingViewが提供または承認する金融、投資、取引、またはその他の種類の助言もしくは推奨であることを意図したものではなく、またこれらに該当するものでもありません。詳細は利用規約をご覧ください。
免責事項
これらの情報および投稿は、TradingViewが提供または承認する金融、投資、取引、またはその他の種類の助言もしくは推奨であることを意図したものではなく、またこれらに該当するものでもありません。詳細は利用規約をご覧ください。