
📊 STWP Equity Snapshot
________________________________________
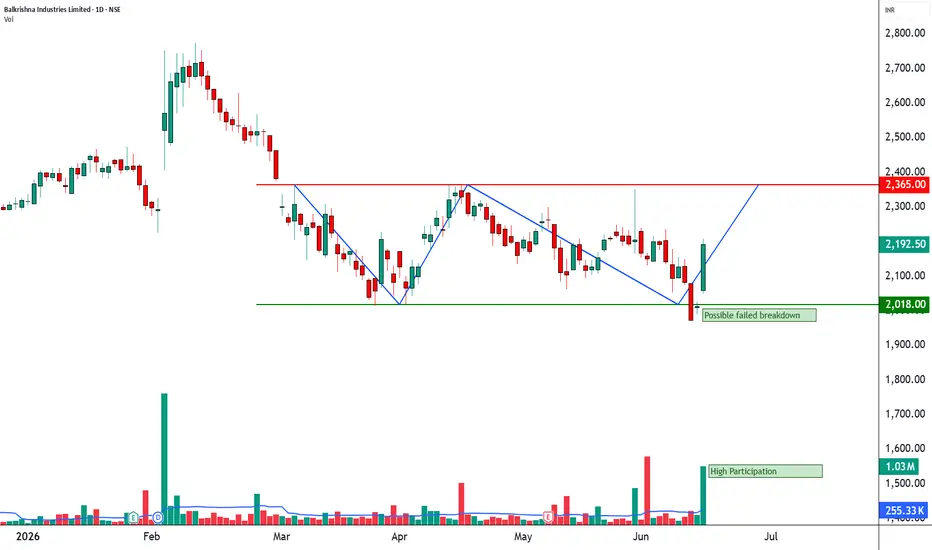
MARKET STRUCTURE SNAPSHOT | NSE: BALKRISIND | DAILY
________________________________________
• Closing Price: ₹2,192.50 (+₹179.40 | +8.91%)
• Core Trend: Downtrend (Swing Structure)
• Market State: Three Inside Up Reversal Pattern Detected
• Price Structure: Strong bullish recovery emerging from lower-range support
________________________________________
OPERATIONAL PRICE GRID & KEY REFERENCE LEVELS
________________________________________
• Model Reference Level: ₹2,209.50
• Hard Invalidation Level: ₹1,965.85
• Structural Risk: ₹243.65 (11.03%)
• Resistance Levels: R1 ₹2,251.23 | R2 ₹2,309.97 | R3 ₹2,410.43
• Support Levels: S1 ₹2,092.03 | S2 ₹1,991.57 | S3 ₹1,932.83
• Range Structure: Low ₹2,018.00 | High ₹2,365.00
• Higher Timeframe Observation Zones: ₹2,453.15 | ₹2,696.85
________________________________________
MOMENTUM, PARTICIPATION & CPR DATA
________________________________________
• Volume Profile: 1.03M Shares
• Volume Character: Extremely High Relative Participation
• RSI Metric: 53.34 (Bullish Recovery Zone)
• ADX Reading: 15.42 (Neutral Trend Environment)
• ROC: +1.14%
• MACD Status: Stabilizing Recovery Structure
• Stochastic Reading: 56.32 (Neutral Recovery Phase)
• Current Bias: WAIT & WATCH
• CPR State: Bullish Zone
• Today's CPR: Pivot 2010.05 | Top 2011.55 | Base 2008.50
• Tomorrow's CPR (Projected): Pivot 2150.75 | Top 2171.65 | Base 2129.90
________________________________________
📚 EDUCATIONAL OBSERVATION
________________________________________
Balkrishna Industries has generated a strong bullish recovery candle supported by exceptionally high market participation. Trading volume expanded to approximately 1.03 million shares, significantly above recent average activity, indicating strong buyer participation behind the move. The session also produced a Three Inside Up bullish reversal pattern, a candlestick formation commonly associated with improving sentiment following a period of weakness. The STWP model currently assigns a reliability score of approximately 82%, while bearish strength has weakened considerably and bullish strength has improved, supporting the developing recovery structure.
From a structural perspective, the stock has rebounded sharply from the lower end of its established trading range. The current range structure extends from approximately ₹2,018 on the lower side to ₹2,365 on the upper side, placing the stock in the middle portion of the range following the recent recovery. The rebound originated after buyers defended the lower-range support area, resulting in a strong bullish candle that has pushed price back toward the Model Reference Level of ₹2,209.50. Immediate attention now shifts toward the nearby resistance cluster between ₹2,251 and ₹2,310, while the range ceiling near ₹2,365 remains an important observation zone.
Momentum conditions have improved but remain in the early stages of recovery. RSI has recovered to 53.34 and moved back into a constructive zone, reflecting strengthening momentum conditions. MACD is showing signs of stabilization following recent weakness, while Stochastic readings continue supporting the ongoing recovery phase. ADX remains relatively subdued at 15.42, indicating that although participation has improved significantly, a strong directional trend has not yet been fully established.
The projected CPR for the next session has shifted meaningfully higher, with a projected Pivot level of ₹2,150.75. A rising CPR framework generally reflects improving market acceptance of higher prices. However, the dashboard continues to classify the broader market environment as range-bound with no strong directional edge currently visible. Market participants may therefore continue monitoring for additional confirmation before a sustained directional move develops.
The current structural risk between the Model Reference Level and the Hard Invalidation Level stands at ₹243.65 or approximately 11.03%. This provides context regarding the downside distance available before the current technical framework would require reassessment. Beyond the immediate range structure, higher timeframe observation zones remain positioned near ₹2,453 and ₹2,697, representing areas where future market reactions may become relevant.
Support and resistance levels should be treated as observation zones rather than predictive targets. Chart patterns, momentum indicators, volume analysis, and CPR frameworks are educational tools that help market participants understand evolving market structure within a disciplined risk-management framework.
________________________________________
⚠️ Disclaimer
________________________________________
• This analysis is provided strictly for educational and informational purposes.
• This is not financial, investment, or trading advice and should not be considered a recommendation to buy or sell any security.
• Stock market investments are subject to market risks, including the possible loss of capital.
• Past performance, historical observations, chart patterns, and technical indicators do not guarantee future results.
• Please conduct your own research and consult a SEBI-registered financial advisor before making investment decisions.
• STWP assumes no responsibility or liability for any financial loss arising directly or indirectly from the use of this information.
________________________________________
MARKET STRUCTURE SNAPSHOT | NSE: BALKRISIND | DAILY
________________________________________
• Closing Price: ₹2,192.50 (+₹179.40 | +8.91%)
• Core Trend: Downtrend (Swing Structure)
• Market State: Three Inside Up Reversal Pattern Detected
• Price Structure: Strong bullish recovery emerging from lower-range support
________________________________________
OPERATIONAL PRICE GRID & KEY REFERENCE LEVELS
________________________________________
• Model Reference Level: ₹2,209.50
• Hard Invalidation Level: ₹1,965.85
• Structural Risk: ₹243.65 (11.03%)
• Resistance Levels: R1 ₹2,251.23 | R2 ₹2,309.97 | R3 ₹2,410.43
• Support Levels: S1 ₹2,092.03 | S2 ₹1,991.57 | S3 ₹1,932.83
• Range Structure: Low ₹2,018.00 | High ₹2,365.00
• Higher Timeframe Observation Zones: ₹2,453.15 | ₹2,696.85
________________________________________
MOMENTUM, PARTICIPATION & CPR DATA
________________________________________
• Volume Profile: 1.03M Shares
• Volume Character: Extremely High Relative Participation
• RSI Metric: 53.34 (Bullish Recovery Zone)
• ADX Reading: 15.42 (Neutral Trend Environment)
• ROC: +1.14%
• MACD Status: Stabilizing Recovery Structure
• Stochastic Reading: 56.32 (Neutral Recovery Phase)
• Current Bias: WAIT & WATCH
• CPR State: Bullish Zone
• Today's CPR: Pivot 2010.05 | Top 2011.55 | Base 2008.50
• Tomorrow's CPR (Projected): Pivot 2150.75 | Top 2171.65 | Base 2129.90
________________________________________
📚 EDUCATIONAL OBSERVATION
________________________________________
Balkrishna Industries has generated a strong bullish recovery candle supported by exceptionally high market participation. Trading volume expanded to approximately 1.03 million shares, significantly above recent average activity, indicating strong buyer participation behind the move. The session also produced a Three Inside Up bullish reversal pattern, a candlestick formation commonly associated with improving sentiment following a period of weakness. The STWP model currently assigns a reliability score of approximately 82%, while bearish strength has weakened considerably and bullish strength has improved, supporting the developing recovery structure.
From a structural perspective, the stock has rebounded sharply from the lower end of its established trading range. The current range structure extends from approximately ₹2,018 on the lower side to ₹2,365 on the upper side, placing the stock in the middle portion of the range following the recent recovery. The rebound originated after buyers defended the lower-range support area, resulting in a strong bullish candle that has pushed price back toward the Model Reference Level of ₹2,209.50. Immediate attention now shifts toward the nearby resistance cluster between ₹2,251 and ₹2,310, while the range ceiling near ₹2,365 remains an important observation zone.
Momentum conditions have improved but remain in the early stages of recovery. RSI has recovered to 53.34 and moved back into a constructive zone, reflecting strengthening momentum conditions. MACD is showing signs of stabilization following recent weakness, while Stochastic readings continue supporting the ongoing recovery phase. ADX remains relatively subdued at 15.42, indicating that although participation has improved significantly, a strong directional trend has not yet been fully established.
The projected CPR for the next session has shifted meaningfully higher, with a projected Pivot level of ₹2,150.75. A rising CPR framework generally reflects improving market acceptance of higher prices. However, the dashboard continues to classify the broader market environment as range-bound with no strong directional edge currently visible. Market participants may therefore continue monitoring for additional confirmation before a sustained directional move develops.
The current structural risk between the Model Reference Level and the Hard Invalidation Level stands at ₹243.65 or approximately 11.03%. This provides context regarding the downside distance available before the current technical framework would require reassessment. Beyond the immediate range structure, higher timeframe observation zones remain positioned near ₹2,453 and ₹2,697, representing areas where future market reactions may become relevant.
Support and resistance levels should be treated as observation zones rather than predictive targets. Chart patterns, momentum indicators, volume analysis, and CPR frameworks are educational tools that help market participants understand evolving market structure within a disciplined risk-management framework.
________________________________________
⚠️ Disclaimer
________________________________________
• This analysis is provided strictly for educational and informational purposes.
• This is not financial, investment, or trading advice and should not be considered a recommendation to buy or sell any security.
• Stock market investments are subject to market risks, including the possible loss of capital.
• Past performance, historical observations, chart patterns, and technical indicators do not guarantee future results.
• Please conduct your own research and consult a SEBI-registered financial advisor before making investment decisions.
• STWP assumes no responsibility or liability for any financial loss arising directly or indirectly from the use of this information.

STWP | Mentor & Demand-Supply Specialist |
Empowering traders through structured learning |
simpletradewithpatience.com
Community: chat.whatsapp.com/BEYz0tkqP0fJPBCWf59uel
wa.me/message/6IOPHGOXMGZ4N1
Educational Only
Empowering traders through structured learning |
simpletradewithpatience.com
Community: chat.whatsapp.com/BEYz0tkqP0fJPBCWf59uel
wa.me/message/6IOPHGOXMGZ4N1
Educational Only
免責事項
これらの情報および投稿は、TradingViewが提供または承認する金融、投資、取引、またはその他の種類の助言もしくは推奨であることを意図したものではなく、またこれらに該当するものでもありません。詳細は利用規約をご覧ください。
STWP | Mentor & Demand-Supply Specialist |
Empowering traders through structured learning |
simpletradewithpatience.com
Community: chat.whatsapp.com/BEYz0tkqP0fJPBCWf59uel
wa.me/message/6IOPHGOXMGZ4N1
Educational Only
Empowering traders through structured learning |
simpletradewithpatience.com
Community: chat.whatsapp.com/BEYz0tkqP0fJPBCWf59uel
wa.me/message/6IOPHGOXMGZ4N1
Educational Only
免責事項
これらの情報および投稿は、TradingViewが提供または承認する金融、投資、取引、またはその他の種類の助言もしくは推奨であることを意図したものではなく、またこれらに該当するものでもありません。詳細は利用規約をご覧ください。