
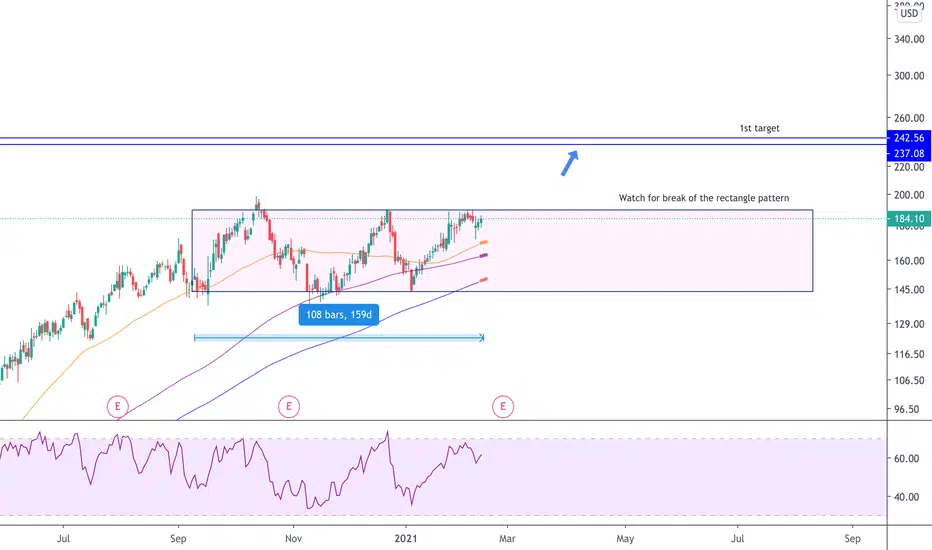
Nice multi month consolidation on BAND.
The chart has formed a rectangle pattern which will either lead to reversal or continuation.
The rectangle pattern can be successfully traded by buying at support (143) and selling at resistance (190) or by waiting for a breakout from the formation.
With all the moving averages rising to support the price I would bet on an imminent break out and continuation to the upside.
The measured move or initial target is calculated by adding the width of the rectangle to the break out point, which is in the 237-242 zone. The reliability of this pattern is high (about 79%).
I'll be watching for a break out of the rectangle to initiate a long position.
Trade safe.
The chart has formed a rectangle pattern which will either lead to reversal or continuation.
The rectangle pattern can be successfully traded by buying at support (143) and selling at resistance (190) or by waiting for a breakout from the formation.
With all the moving averages rising to support the price I would bet on an imminent break out and continuation to the upside.
The measured move or initial target is calculated by adding the width of the rectangle to the break out point, which is in the 237-242 zone. The reliability of this pattern is high (about 79%).
I'll be watching for a break out of the rectangle to initiate a long position.
Trade safe.

免責事項
これらの情報および投稿は、TradingViewが提供または承認する金融、投資、取引、またはその他の種類の助言もしくは推奨であることを意図したものではなく、またこれらに該当するものでもありません。詳細は利用規約をご覧ください。
免責事項
これらの情報および投稿は、TradingViewが提供または承認する金融、投資、取引、またはその他の種類の助言もしくは推奨であることを意図したものではなく、またこれらに該当するものでもありません。詳細は利用規約をご覧ください。