
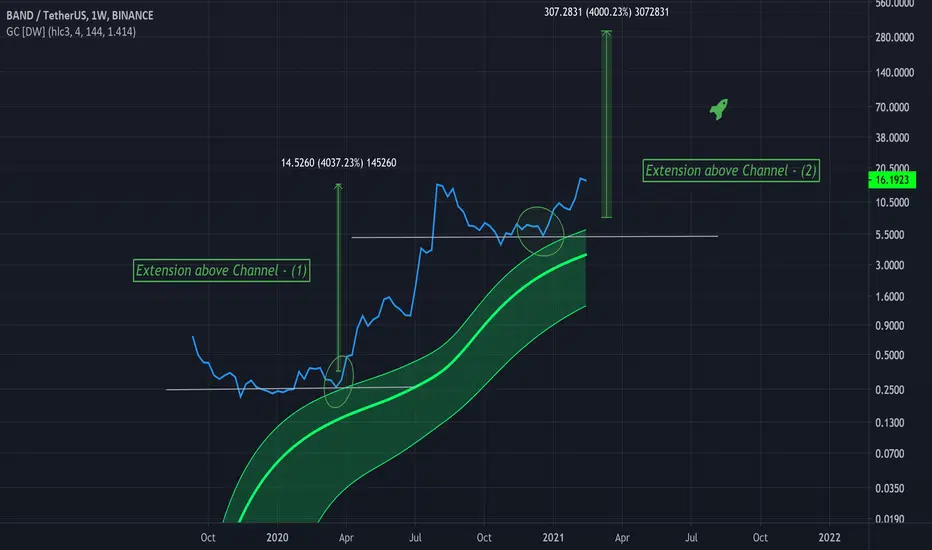
Within the green circles touches on the Gaussian channel can be seen, well, clearly on the first one, the second one is a bit above.
This is a great bounce area for price as price is in a full bull trend, as shown by the Gaussian indicator.
This is the chart for BANDUSDT, and if this second circle acts as a touch on the Gaussian indicator a strong bounce upward could occur.
And if history holds any merit, a 4000% move up could be in play.
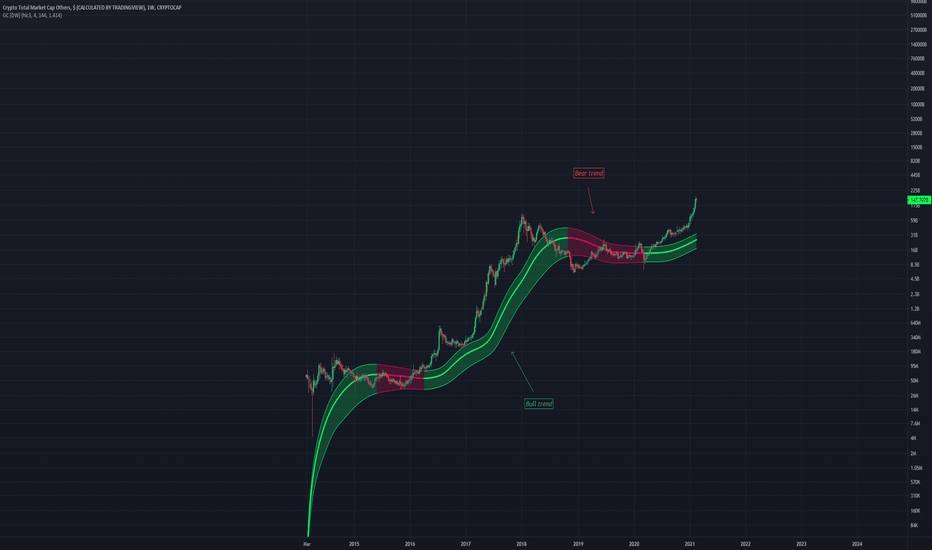
Above is a chart that has a link to this indicator in the comments.
It is very helpful.
This is a great bounce area for price as price is in a full bull trend, as shown by the Gaussian indicator.
This is the chart for BANDUSDT, and if this second circle acts as a touch on the Gaussian indicator a strong bounce upward could occur.
And if history holds any merit, a 4000% move up could be in play.
Above is a chart that has a link to this indicator in the comments.
It is very helpful.

免責事項
これらの情報および投稿は、TradingViewが提供または承認する金融、投資、取引、またはその他の種類の助言もしくは推奨であることを意図したものではなく、またこれらに該当するものでもありません。詳細は利用規約をご覧ください。
免責事項
これらの情報および投稿は、TradingViewが提供または承認する金融、投資、取引、またはその他の種類の助言もしくは推奨であることを意図したものではなく、またこれらに該当するものでもありません。詳細は利用規約をご覧ください。