
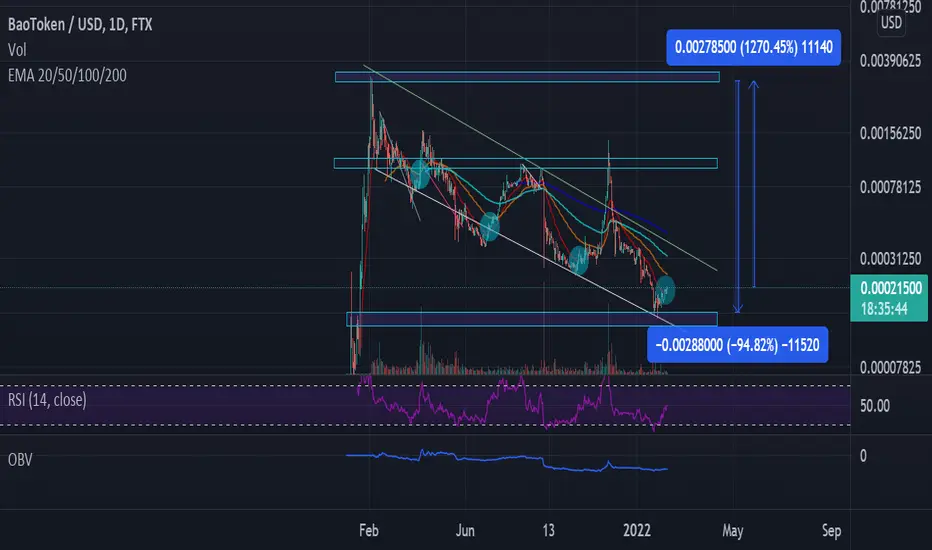
just highlighting the extreme volatility of cryptocurrencys
+ cyclic swings within a fullish market cycle
historically taking the 20ema has lead to a brief bullish price action before eventual downswings
the yearly range shows swing is -94% with a high of +1000% from current kinda bullflag (downtrend) structure
was pumped to an incredibly high marketcap on uniswap before listing and farmer profit takers have seen a slow burn almost complete devaluation, what a crazy chart

免責事項
これらの情報および投稿は、TradingViewが提供または承認する金融、投資、取引、またはその他の種類の助言もしくは推奨であることを意図したものではなく、またこれらに該当するものでもありません。詳細は利用規約をご覧ください。
免責事項
これらの情報および投稿は、TradingViewが提供または承認する金融、投資、取引、またはその他の種類の助言もしくは推奨であることを意図したものではなく、またこれらに該当するものでもありません。詳細は利用規約をご覧ください。