Analytics BAT/BTC
BAT / BTC analytics
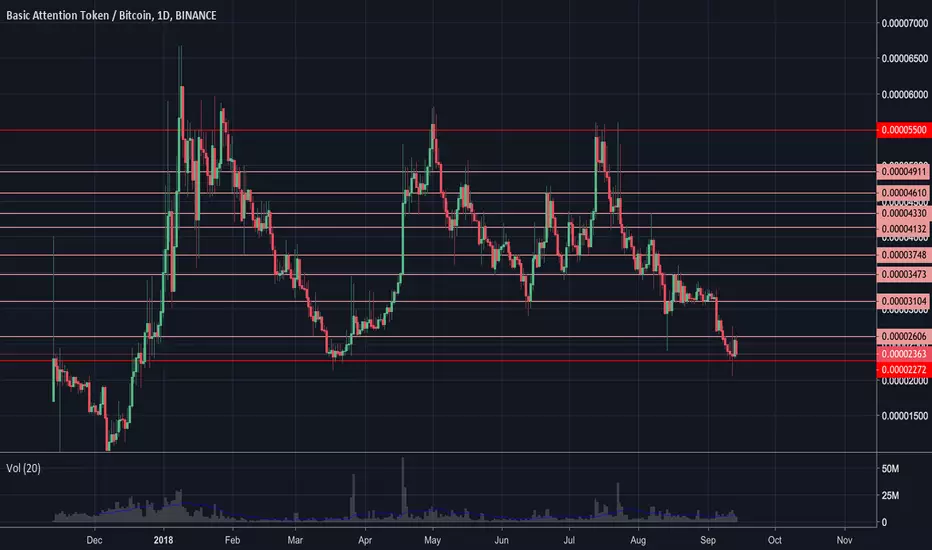
On the daily chart, we observe a lateral trend in the range 0.000055-0.00002250, which opens up good prospects for medium-term trading. A distinctive feature is the lack of strong resistance and support zones, so the described channel can be punched in any direction. It is characteristic that inside the same platform the price of a coin when buying for USD and for BTC may differ to 10%, which opens up opportunities for arbitrage trading.
The asset does not have a stable daily turnover, it can differ 30 times and fluctuate from 50 to 1500 BTC per day. When trading this coin do not work stop-loss, because the spread can be 20-30%.
There are no strong levels so to confirm the hypotheses, regarding the direction of motion, it is necessary to analyze the charts on smaller timeframes.
On the daily chart, we observe a lateral trend in the range 0.000055-0.00002250, which opens up good prospects for medium-term trading. A distinctive feature is the lack of strong resistance and support zones, so the described channel can be punched in any direction. It is characteristic that inside the same platform the price of a coin when buying for USD and for BTC may differ to 10%, which opens up opportunities for arbitrage trading.
The asset does not have a stable daily turnover, it can differ 30 times and fluctuate from 50 to 1500 BTC per day. When trading this coin do not work stop-loss, because the spread can be 20-30%.
There are no strong levels so to confirm the hypotheses, regarding the direction of motion, it is necessary to analyze the charts on smaller timeframes.

免責事項
これらの情報および投稿は、TradingViewが提供または承認する金融、投資、取引、またはその他の種類の助言もしくは推奨であることを意図したものではなく、またこれらに該当するものでもありません。詳細は利用規約をご覧ください。
免責事項
これらの情報および投稿は、TradingViewが提供または承認する金融、投資、取引、またはその他の種類の助言もしくは推奨であることを意図したものではなく、またこれらに該当するものでもありません。詳細は利用規約をご覧ください。