ロング
BAT-BTC : Next steps
Hi everybody,
this can be easily sorted to Beyond Technical analysis category.
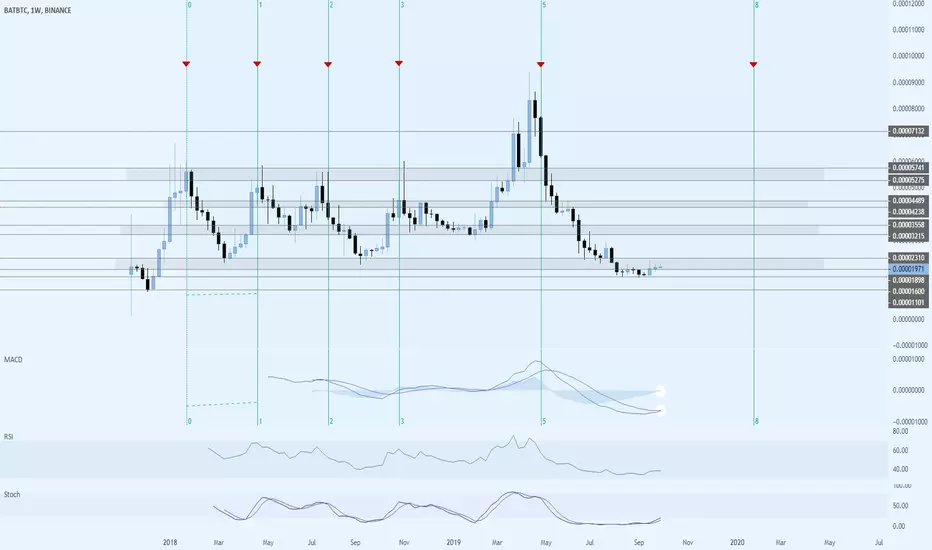
There is no philosophical background behind this idea, I just played with fibs time zones a little and all past tops pretty fits.
This may be just huge coincidence, but let indicators talk:
MACD: golden cross - bullish
MACD: histogram buy signal
STOCH : buy signal
(dotted lines/gray stripes are daily chart resistances)
Realize that this is 1W chart and If trend remains, next top by fib time zone would be at 02/2020.
This is not a financial advice, do your own research.
this can be easily sorted to Beyond Technical analysis category.
There is no philosophical background behind this idea, I just played with fibs time zones a little and all past tops pretty fits.
This may be just huge coincidence, but let indicators talk:
MACD: golden cross - bullish
MACD: histogram buy signal
STOCH : buy signal
(dotted lines/gray stripes are daily chart resistances)
Realize that this is 1W chart and If trend remains, next top by fib time zone would be at 02/2020.
This is not a financial advice, do your own research.

免責事項
これらの情報および投稿は、TradingViewが提供または承認する金融、投資、取引、またはその他の種類の助言もしくは推奨であることを意図したものではなく、またこれらに該当するものでもありません。詳細は利用規約をご覧ください。
免責事項
これらの情報および投稿は、TradingViewが提供または承認する金融、投資、取引、またはその他の種類の助言もしくは推奨であることを意図したものではなく、またこれらに該当するものでもありません。詳細は利用規約をご覧ください。