
Hello,
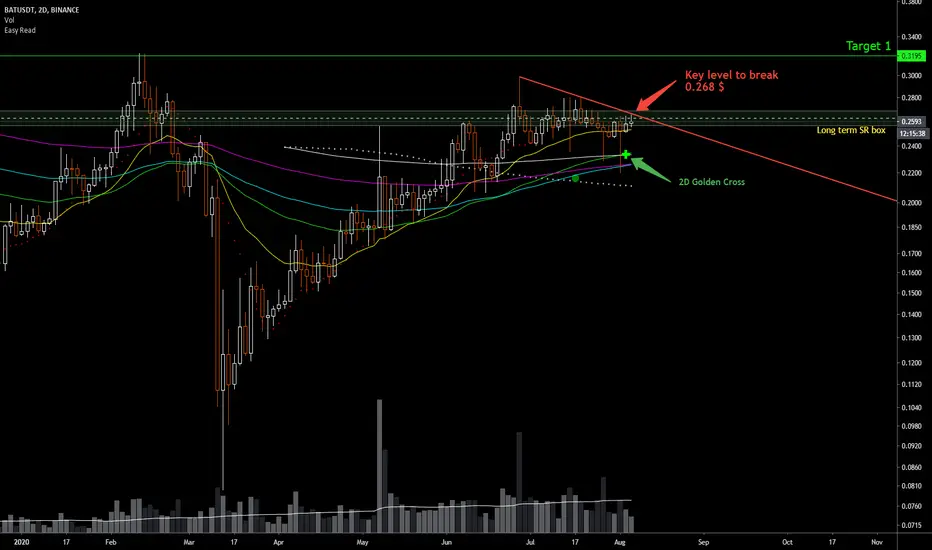
Here we have 2D chart for BAT, we now have confirmed 2D golden cross and BAT is approaching key long term SR levels. I would like to see a clean break above 0.268$ level and then we can head for two key targets on the upside.

If we see BAT break above 0.44$ then it will be in a blue sky break out and can reach higher level with strong FOMO kicking in. But for now I am going step-by-step :)
Happy and safe trading...
chao...
Here we have 2D chart for BAT, we now have confirmed 2D golden cross and BAT is approaching key long term SR levels. I would like to see a clean break above 0.268$ level and then we can head for two key targets on the upside.
If we see BAT break above 0.44$ then it will be in a blue sky break out and can reach higher level with strong FOMO kicking in. But for now I am going step-by-step :)
Happy and safe trading...
chao...

免責事項
これらの情報および投稿は、TradingViewが提供または承認する金融、投資、取引、またはその他の種類の助言もしくは推奨であることを意図したものではなく、またこれらに該当するものでもありません。詳細は利用規約をご覧ください。
免責事項
これらの情報および投稿は、TradingViewが提供または承認する金融、投資、取引、またはその他の種類の助言もしくは推奨であることを意図したものではなく、またこれらに該当するものでもありません。詳細は利用規約をご覧ください。