ロング
BBBY LONG
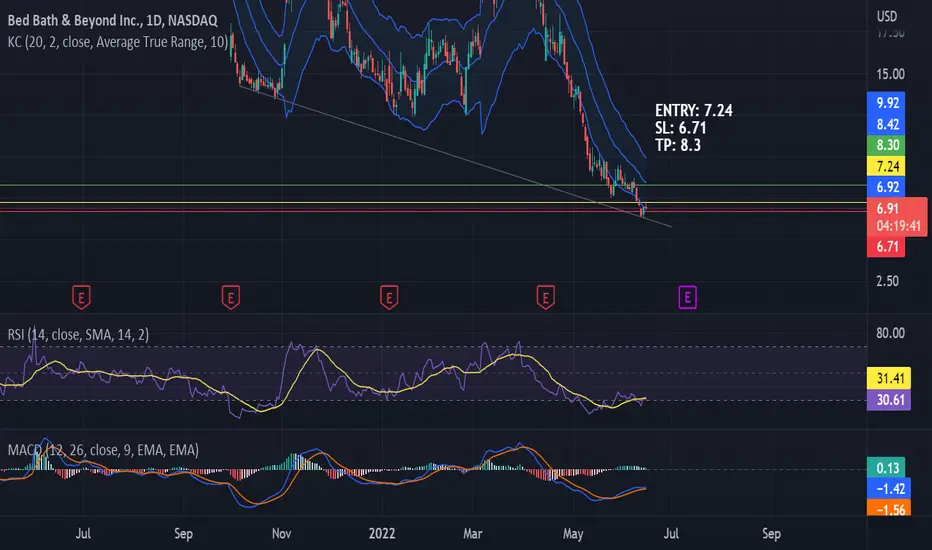
The grey trend line seems to well describe last years trend. It is easier to see that on weekly time frame. We could say it works as a support level because every time the price bounces back to a higher level so we can expect this time to happen the same.
At this moment the price is testing lower Keltner Channels band and trying to get above it.
RSI is close to crossing signal line on daily time frame as it already crossed on 4H time frame.
MACD is rising.
ENTRY: 7.24
SL: 6.71
TP: 8.3
At this moment the price is testing lower Keltner Channels band and trying to get above it.
RSI is close to crossing signal line on daily time frame as it already crossed on 4H time frame.
MACD is rising.
ENTRY: 7.24
SL: 6.71
TP: 8.3

💥 Free signals and ideas ➡ t.me/vfinvestment
免責事項
これらの情報および投稿は、TradingViewが提供または承認する金融、投資、取引、またはその他の種類の助言もしくは推奨であることを意図したものではなく、またこれらに該当するものでもありません。詳細は利用規約をご覧ください。
💥 Free signals and ideas ➡ t.me/vfinvestment
免責事項
これらの情報および投稿は、TradingViewが提供または承認する金融、投資、取引、またはその他の種類の助言もしくは推奨であることを意図したものではなく、またこれらに該当するものでもありません。詳細は利用規約をご覧ください。