
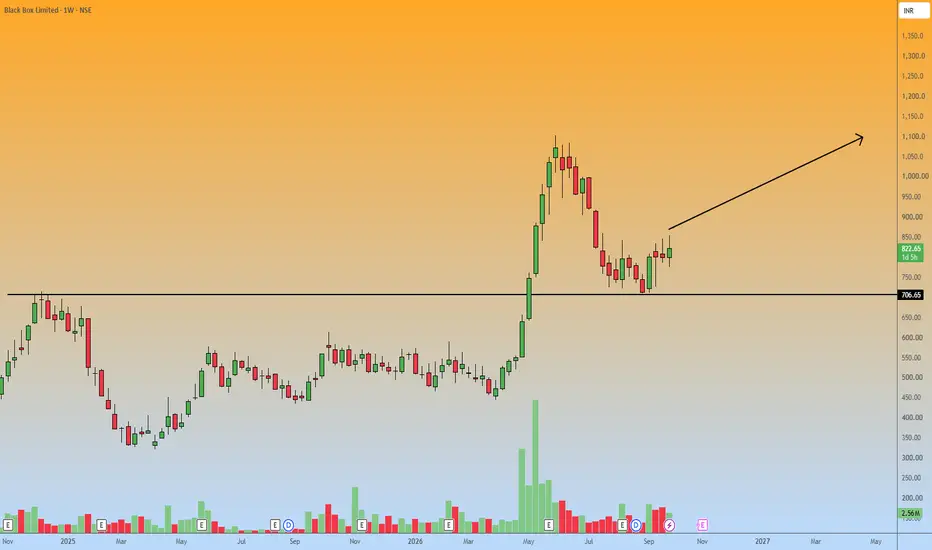
The weekly chart for Black Box Limited reveals a clear technical setup following a textbook retest of historical structure.
After a massive volume-backed rally that peaked near the 1,100 mark, the stock underwent a natural retracement.
It has now successfully pulled back to a critical horizontal support zone at exactly 706.65.
The recent price action shows a strong bullish bounce off this 706.65 level, indicating that buyers are aggressively defending this previous breakout area.
With the asset currently trading around 823.00, this structural retest provides a solid foundation for a long position, adhering to the guideline of explaining the core reasoning behind the analysis.
Bias: Long
Entry Point: Consider an initial entry near the current market price of 823.00, while looking to accumulate on any minor pullbacks into the 780–810 zone to optimize the risk-to-reward ratio.
Target: The primary upside target is a retest of the previous major swing high near 1,100.
A secondary, more conservative target can be placed at the intermediate resistance around 950.
Stop Loss: A strict stop loss should be placed below the primary 706.65 support line.
A weekly close below 680 would break the market structure and immediately invalidate this bullish thesis.
After a massive volume-backed rally that peaked near the 1,100 mark, the stock underwent a natural retracement.
It has now successfully pulled back to a critical horizontal support zone at exactly 706.65.
The recent price action shows a strong bullish bounce off this 706.65 level, indicating that buyers are aggressively defending this previous breakout area.
With the asset currently trading around 823.00, this structural retest provides a solid foundation for a long position, adhering to the guideline of explaining the core reasoning behind the analysis.
Bias: Long
Entry Point: Consider an initial entry near the current market price of 823.00, while looking to accumulate on any minor pullbacks into the 780–810 zone to optimize the risk-to-reward ratio.
Target: The primary upside target is a retest of the previous major swing high near 1,100.
A secondary, more conservative target can be placed at the intermediate resistance around 950.
Stop Loss: A strict stop loss should be placed below the primary 706.65 support line.
A weekly close below 680 would break the market structure and immediately invalidate this bullish thesis.

免責事項
これらの情報および投稿は、TradingViewが提供または承認する金融、投資、取引、またはその他の種類の助言もしくは推奨であることを意図したものではなく、またこれらに該当するものでもありません。詳細は利用規約をご覧ください。
免責事項
これらの情報および投稿は、TradingViewが提供または承認する金融、投資、取引、またはその他の種類の助言もしくは推奨であることを意図したものではなく、またこれらに該当するものでもありません。詳細は利用規約をご覧ください。