アップデート済
Bitcoin Cash in Ascending Triangle Breakout Pattern.
Hey, I am back with another Technical Analysis, this time looking at Bitcoin Cash.
Lets keep it simple and just right on look at the chart.
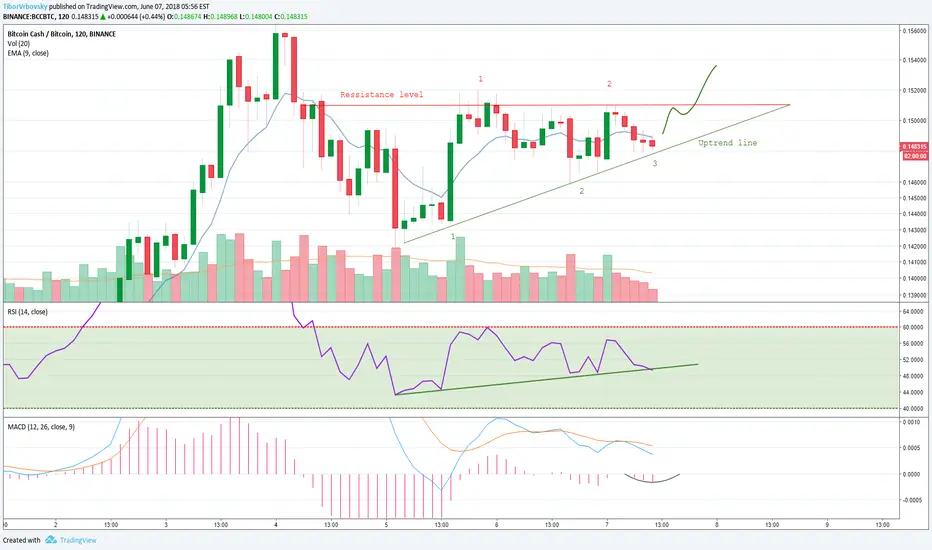
On the chart you can see Ascending Triangle that has formed, if Triangle has to be valid it has to seen at least 2 swings high and 2 swings low, currently there are 2 up and 3 down.
Bassicaly in ascending triangle you have one strong ressistance level and increasing demand on Uptrend line, thats how Ascending Triangle is being formed.
Lets just move by looking at Indicators.
RSI shows clear uptrend ( demand increasing over time).
MACD shows really small period cycles, currently Bitcoin Cash should start curve upwards by bouncing off uptrend line in chart.
So I think thats about it.. If you have any Questions feel free to ask me down bellow or at my Discord channel!
Hope I made your view on whats going on with Bitcoin Cash somewhat clearer.
If you like this Technical Analysis let me know in the comments, Likes are aprreciated, Thanks !
If I see something worth to share on the chart I will surely do an Update.
Lets keep it simple and just right on look at the chart.
On the chart you can see Ascending Triangle that has formed, if Triangle has to be valid it has to seen at least 2 swings high and 2 swings low, currently there are 2 up and 3 down.
Bassicaly in ascending triangle you have one strong ressistance level and increasing demand on Uptrend line, thats how Ascending Triangle is being formed.
Lets just move by looking at Indicators.
RSI shows clear uptrend ( demand increasing over time).
MACD shows really small period cycles, currently Bitcoin Cash should start curve upwards by bouncing off uptrend line in chart.
So I think thats about it.. If you have any Questions feel free to ask me down bellow or at my Discord channel!
Hope I made your view on whats going on with Bitcoin Cash somewhat clearer.
If you like this Technical Analysis let me know in the comments, Likes are aprreciated, Thanks !
If I see something worth to share on the chart I will surely do an Update.
注文をキャンセル
Now I understand why so many people hate Bitcoin Cash, first unsuccesfull ascending Triangle.
免責事項
これらの情報および投稿は、TradingViewが提供または承認する金融、投資、取引、またはその他の種類の助言もしくは推奨であることを意図したものではなく、またこれらに該当するものでもありません。詳細は利用規約をご覧ください。
免責事項
これらの情報および投稿は、TradingViewが提供または承認する金融、投資、取引、またはその他の種類の助言もしくは推奨であることを意図したものではなく、またこれらに該当するものでもありません。詳細は利用規約をご覧ください。