BCD/BTC waving a bull flag?
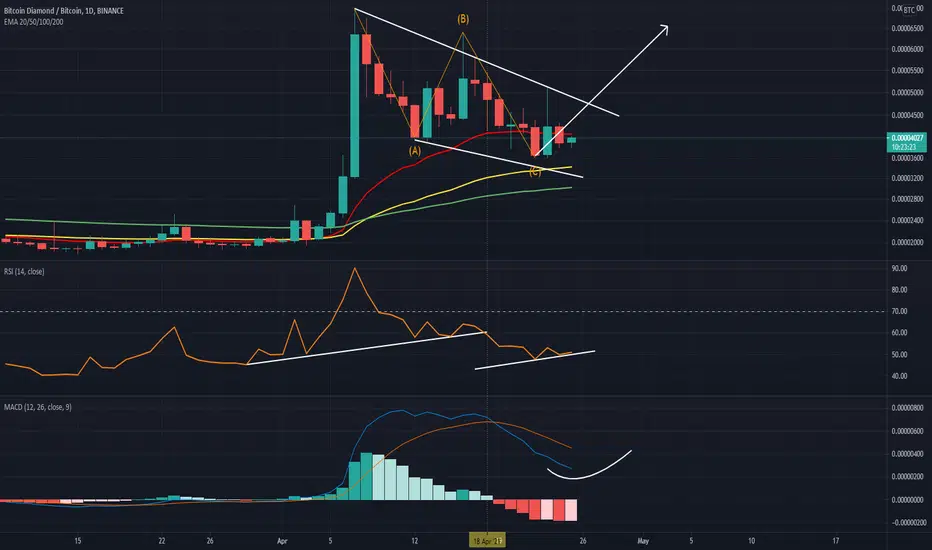
BCD/BTC daily chart looks like it's forming a bull flag.
Possible ABC correction wave within the flag.
Looking at it in this perspective makes what happened on the 18th look like not-a-big-deal.
If this pattern holds I would expect the MACD to start moving up and eventually cross in the next few days.
It's currently riding just below the 20 day EMA. At the beginning of April it crossed above the 20 day EMA and used it as launching pad.
BCD/BTC has made explosive moves in the past so when it moves expect fireworks.
$BINANCE:BCDBTC
Possible ABC correction wave within the flag.
Looking at it in this perspective makes what happened on the 18th look like not-a-big-deal.
If this pattern holds I would expect the MACD to start moving up and eventually cross in the next few days.
It's currently riding just below the 20 day EMA. At the beginning of April it crossed above the 20 day EMA and used it as launching pad.
BCD/BTC has made explosive moves in the past so when it moves expect fireworks.
$BINANCE:BCDBTC

関連の投稿
免責事項
これらの情報および投稿は、TradingViewが提供または承認する金融、投資、取引、またはその他の種類の助言もしくは推奨であることを意図したものではなく、またこれらに該当するものでもありません。詳細は利用規約をご覧ください。
免責事項
これらの情報および投稿は、TradingViewが提供または承認する金融、投資、取引、またはその他の種類の助言もしくは推奨であることを意図したものではなく、またこれらに該当するものでもありません。詳細は利用規約をご覧ください。