
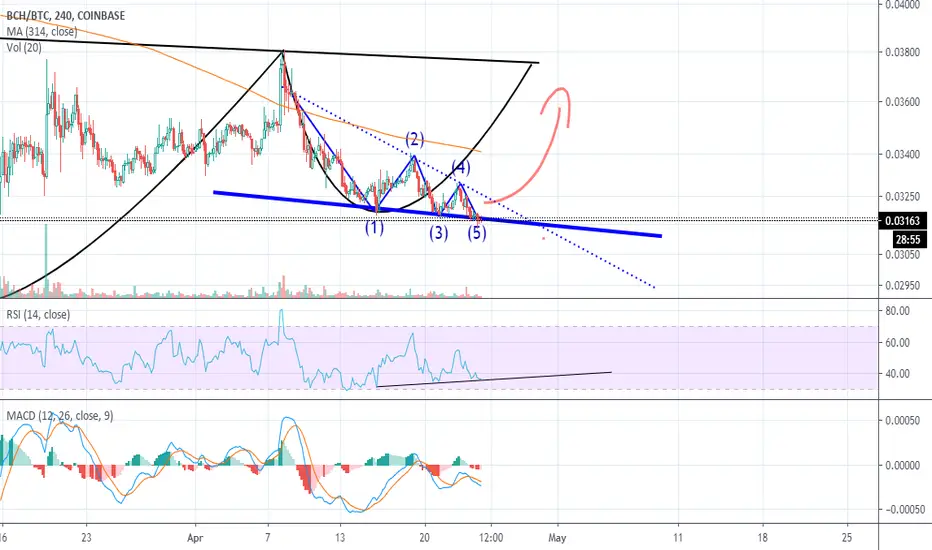
It looks like bch has completed a falling wedge pattern, which is often bullish.
The pattern is interesting because there is triple bullish divergence on the RSI, the price in satoshi is dropping, but the momentum isn't following to the downside. A bounce could be incoming. This combined with the btc halving could see bch propel higher.
IF it breaks the dotted line (resistance line), then it's highly likely that bch will complete the inverse head and shoulders reversal pattern.
The same structure can be observed in other coins as well, such as ETC.
As usual the post is for educational purpose only. :)

免責事項
これらの情報および投稿は、TradingViewが提供または承認する金融、投資、取引、またはその他の種類の助言もしくは推奨であることを意図したものではなく、またこれらに該当するものでもありません。詳細は利用規約をご覧ください。
免責事項
これらの情報および投稿は、TradingViewが提供または承認する金融、投資、取引、またはその他の種類の助言もしくは推奨であることを意図したものではなく、またこれらに該当するものでもありません。詳細は利用規約をご覧ください。