Overview on BCHSV/BTC
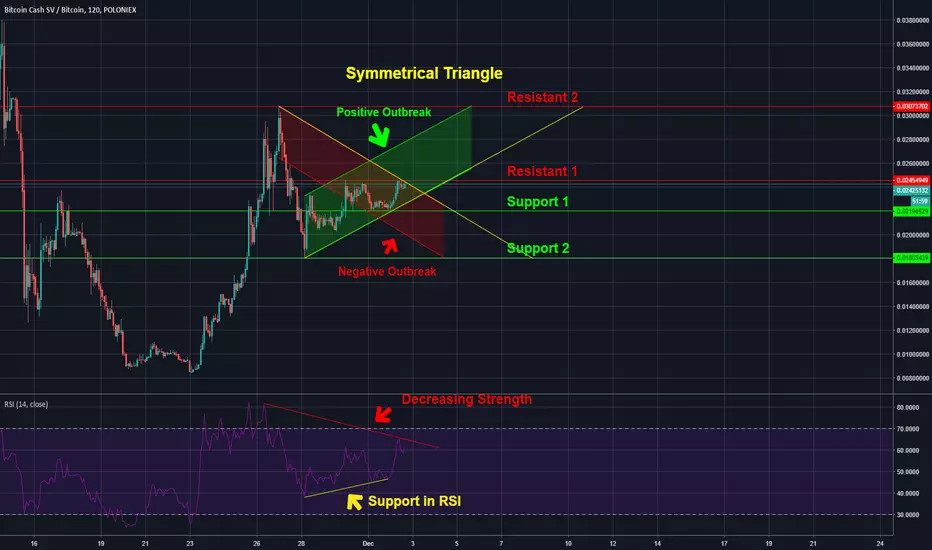
I made this analysis to create a clear view on BCHSV.
The first thing i did was searching for the support and resistant levels.
If you want to find those levels by yourself, you can use the point and
figure chart to identify those levels. The Lower is support and the up-
per resistant.
The second thing i usually do is searching for a trend pattern, in this
case i found a symmetrical triangle. Where the outcome is difficult to
predict. I used the RSI for my prediction, i found decreasing strength
in the RSI. That would say that there is a higher chance for a negative
outbreak to occur.
I hope you guys enjoyed this Technical Analysis.
This post is for educational purposes only.
The first thing i did was searching for the support and resistant levels.
If you want to find those levels by yourself, you can use the point and
figure chart to identify those levels. The Lower is support and the up-
per resistant.
The second thing i usually do is searching for a trend pattern, in this
case i found a symmetrical triangle. Where the outcome is difficult to
predict. I used the RSI for my prediction, i found decreasing strength
in the RSI. That would say that there is a higher chance for a negative
outbreak to occur.
I hope you guys enjoyed this Technical Analysis.
This post is for educational purposes only.

免責事項
これらの情報および投稿は、TradingViewが提供または承認する金融、投資、取引、またはその他の種類の助言もしくは推奨であることを意図したものではなく、またこれらに該当するものでもありません。詳細は利用規約をご覧ください。
免責事項
これらの情報および投稿は、TradingViewが提供または承認する金融、投資、取引、またはその他の種類の助言もしくは推奨であることを意図したものではなく、またこれらに該当するものでもありません。詳細は利用規約をご覧ください。