
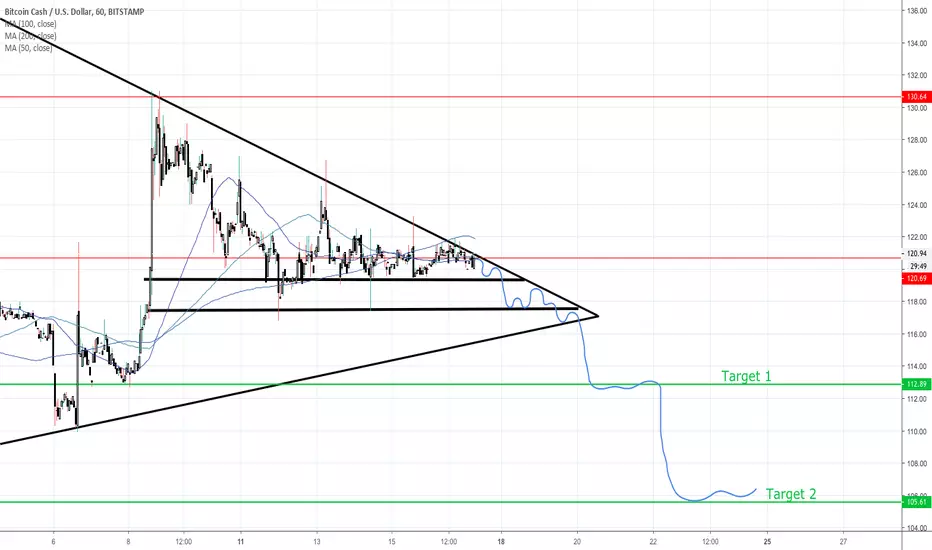
We are approaching the end of this bearish 'looking' triangle (I say 'looking' because there is no certainty!). It looks to be a break to the downside as the bullish indicators have still not shown in full, just check out the trading volume for 1. The question is can we go lower than the all time low? And if so, what are we in for? Let's see and wait what happens!

免責事項
これらの情報および投稿は、TradingViewが提供または承認する金融、投資、取引、またはその他の種類の助言もしくは推奨であることを意図したものではなく、またこれらに該当するものでもありません。詳細は利用規約をご覧ください。
免責事項
これらの情報および投稿は、TradingViewが提供または承認する金融、投資、取引、またはその他の種類の助言もしくは推奨であることを意図したものではなく、またこれらに該当するものでもありません。詳細は利用規約をご覧ください。