
🚀#BCH Analysis :
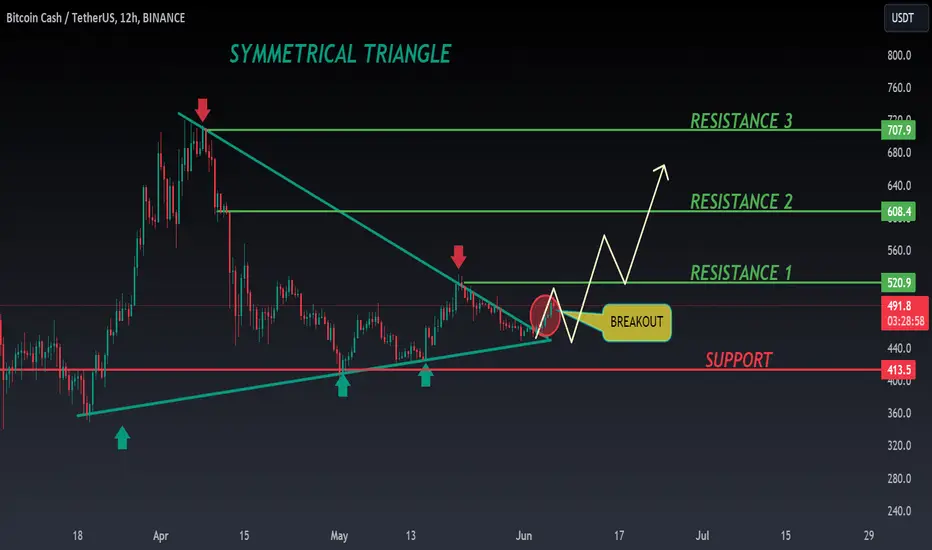
🔮As we can see in the chart of #BCH that there is a formation symmetrical triangle pattern. Also there is a perfect breakout. But there is an instant resistance zone and if #BCH sustain this breakout and also breakout the resistance 1 zone then we would see a bullish move📈📈
🔰Current Price: $492.9
🎯 Target Price: $700
⚡️What to do ?
👀Keep an eye on #BCH price action. We can trade according to the chart and make some profits⚡️⚡️
#BCH #Cryptocurrency #TechnicalAnalysis #DYOR
🔮As we can see in the chart of #BCH that there is a formation symmetrical triangle pattern. Also there is a perfect breakout. But there is an instant resistance zone and if #BCH sustain this breakout and also breakout the resistance 1 zone then we would see a bullish move📈📈
🔰Current Price: $492.9
🎯 Target Price: $700
⚡️What to do ?
👀Keep an eye on #BCH price action. We can trade according to the chart and make some profits⚡️⚡️
#BCH #Cryptocurrency #TechnicalAnalysis #DYOR

免責事項
これらの情報および投稿は、TradingViewが提供または承認する金融、投資、取引、またはその他の種類の助言もしくは推奨であることを意図したものではなく、またこれらに該当するものでもありません。詳細は利用規約をご覧ください。
免責事項
これらの情報および投稿は、TradingViewが提供または承認する金融、投資、取引、またはその他の種類の助言もしくは推奨であることを意図したものではなく、またこれらに該当するものでもありません。詳細は利用規約をご覧ください。