ロング
Update on BCPT
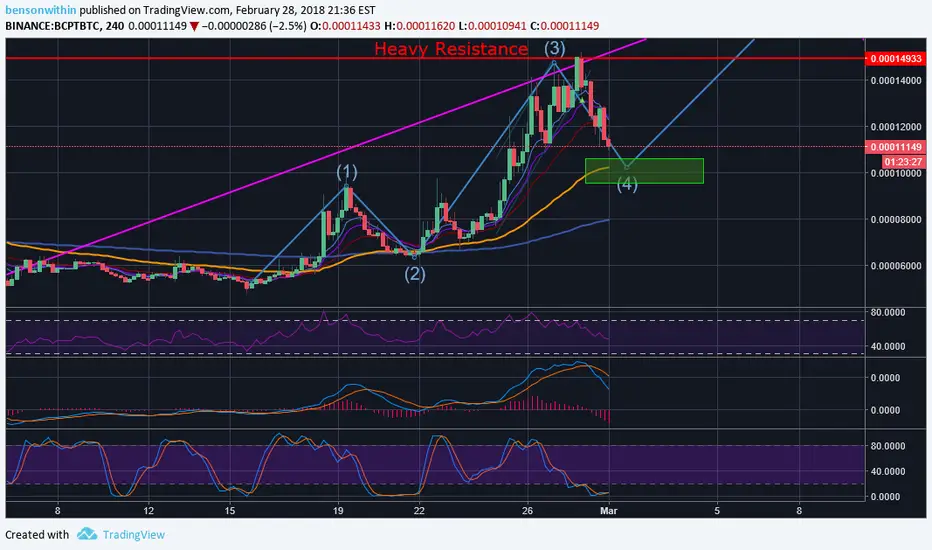
Hi guys! I adjusted my previous chart slightly because the price was moving quicker than anticipated. As you can see I have moved wave 4 to the left to line up better with the current price action. I also adjusted my buy in price indicated by the green rectangle. We hit resistance yesterday and have been traveling down since. My target begins at the 50% fibonacci retracement and extends to the 61.8% level. The bold orange line represents the 55 ema which is rising perfectly to add support to the indicated price target. Because of the power of the 55 ema we should see it act as support. If however we break below the 55 ema, the next support would be at the bottom of the green rectangle which is the 61.8% line and also the top of wave 1.

免責事項
これらの情報および投稿は、TradingViewが提供または承認する金融、投資、取引、またはその他の種類の助言もしくは推奨であることを意図したものではなく、またこれらに該当するものでもありません。詳細は利用規約をご覧ください。
免責事項
これらの情報および投稿は、TradingViewが提供または承認する金融、投資、取引、またはその他の種類の助言もしくは推奨であることを意図したものではなく、またこれらに該当するものでもありません。詳細は利用規約をご覧ください。